Evaluation release. Every feature below is available during the free 14-day trial. After the trial a license key is available on request, issued automatically, and a key can enable or limit individual features per user. Request a license →
When an AI wrote the tests
Coverage against a generated test suite
The overview makes the general case. Here it is against the feature list itself, because a generated suite fails in a characteristic shape — every line touched, half the decisions never taken, and a few functions named in the test titles but never actually called — and five of the things below are what make that shape visible.
- Branch and MC/DC coverage, with the per-arm and per-decision hover, separate the line ran from the decision was exercised. A happy-path suite reads near-100% on lines and near-50% on branches, and that spread is the finding. A green test run shows none of it.
- The composite score is a harmonic mean, so a strong metric cannot mask a weak one — which is exactly the arithmetic a generated suite needs applied to it. Averaging its line number with its branch number would bury the one number worth looking at.
- Dead-code warnings raise a Problems-panel entry for any function with measurable lines and zero coverage. A suite that names a function in a test title and never reaches it fails nowhere else.
- Diff coverage against a git base ref narrows all of the above to the lines that just changed — the code you accepted this afternoon, rather than the repository's lifetime average, which a large existing suite will happily keep looking healthy.
- Copy Uncovered Lines emits precisely what was never run, as Markdown — which is a paste straight back into whichever assistant wrote the suite in the first place.
None of this reads a test and judges it, and nothing here should be taken as claiming otherwise: a test with no assertions at all still covers every line it touches. What these measure is the part a reviewer cannot hold in their head — which code was never executed.
Unique to this extension
Your line coverage says 100%. 312 bytes of your binary never ran.
Every other metric here is measured from source: instrument the code, run the instrumented build, count what fired. Object-code coverage measures something no source-based tool can reach — how much of the built binary actually executed, in instruction bytes, by watching the instruction stream. A compiler emits code no line of your source accounts for: array-bounds checks, switch jump tables, register spills, runtime helpers for division or floating point. None of it appears in your source, so no source-based tool — including this one, for every other metric it reads — can tell you whether it ran. It is also the only metric here that answers does this cover assembly?, since hand-written assembly is never instrumented.
DO-178C names this explicitly: at level A it is required in addition to MC/DC. No other VS Code extension reads it. How to get it off an embedded target →
Capabilities
Core
- A Coverage view of every measured file, the overview ruler and Annotated Source; in the editor's own gutter, by default, only what is worth a mark — MC/DC bars, since-last-run triangles, edited-line dots — with uncovered-only bars or a hit-count heatmap a setting away.
- Per-line statement, branch, function, region, MC/DC and C++ instantiation coverage, whatever the tracefile provides.
- Multi-format ingestion and deterministic merge of several runs with recorded provenance.
- Path remapping — CI build-machine paths → your local workspace.
- Diff coverage — decorate only lines changed vs a git base ref.
- Explorer badges and a run-wide status-bar item, colour-coded by the composite score.
- Watch mode — auto-reload when a tracefile changes.
- Run Tests with Coverage — recognises the test runner from the workspace root and runs it with coverage on, loading what it writes.
- Remote tracefiles — a
coverageFile.pathsentry may be anhttps://URL: the CI artifact is fetched conditionally (ETag / Last-Modified), with the headers you configure inremote.headers, loaded like a local file, and re-fetched on a timer withremote.refreshMinutes; when a fetch fails, the last downloaded copy is loaded instead. - Variables in paths —
${workspaceFolder},${workspaceFolderBasename},${userHome},${env:NAME},${command:id}and${config:section.key}in every path setting; an unknown variable is left as written, so a typo shows up in the discovery log rather than vanishing. - Multi-root workspaces — every folder is discovered from its own settings (its
.vscode/settings.jsonor its.code-workspaceentry), its tracefiles merge into one run, the Coverage view groups the files by folder, and a folder added or removed reloads coverage by itself. - Two more reload triggers — an absolute
coverageFile.pathsentry outside the workspace is polled, so a file appearing there is loaded; andwatch.reloadAfterTasksnames tasks (npm: test) whose ending reloads coverage, whether or not watch mode is on. - Progress you can cancel — a load of ten or more tracefiles, or 8 MB or more of them, and every Generate Full HTML Report run under a progress notification with a Cancel button; cancelling leaves the previous run loaded.
- VS Code's own Test Coverage view — every load is also published through the editor's Test Coverage API (
testCoverage.publish), so the Test Explorer's coverage panel, the Explorer's per-file percentages and the editor's Show Inline Coverage toggle show the same numbers; Show in Test Coverage View publishes on request and opens the panel. With named tests (lcov’sTN:), the view filters a file’s coverage by test. - Suggested remap rule — when a load leaves files unmatched (container or CI paths against a local checkout), the extension infers the
pathRemaprule that explains the most of them, offers Apply Suggested Remap on the load result and Suggest Path Remap Rule in the palette; nothing is written without the click. - Ignore globs —
fuciniCoverage.ignore(vendor/**,**/*.generated.ts) drops whole files from the run at load, so every view, gate and export counts without them; the load result says how many and the output names each one. - Unmeasured versus uncovered — a file no test loaded is not scored as 0% behind your back; the status bar says not measured for one, and
unmeasured.modecan list such files in the Coverage view or count each as an uncovered file, withthreshold.unmeasuredFilesto gate on how many there are. - What merging did, visible — with several tracefiles loaded, every file row names the report its numbers came from, the badge is outlined where those numbers overruled an older report, each tracefile row counts how many of its files were overruled or overruled others, and clicking a tracefile row highlights its files in the tree (
coverageView.mergedMarks).
Composite score & compliance
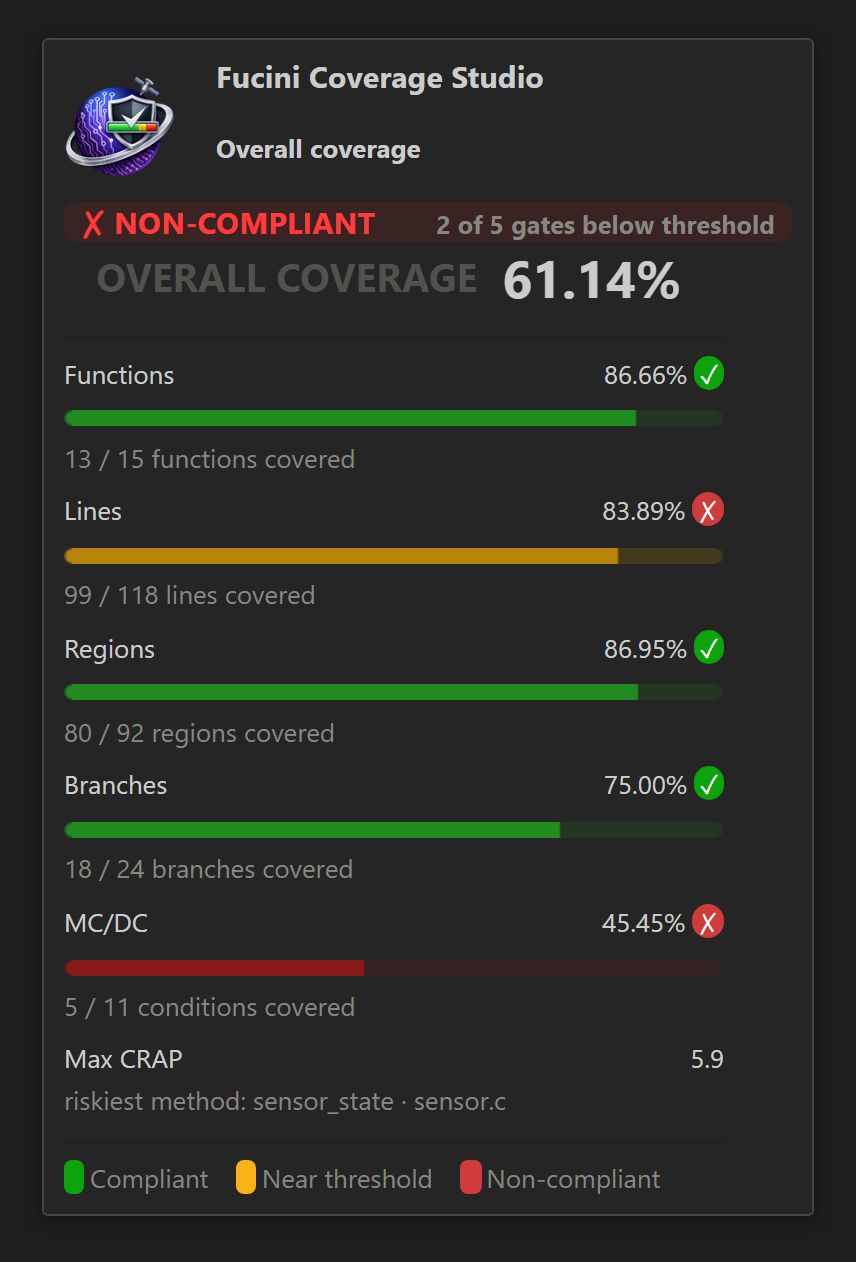
A single Weighted Harmonic Mean across lines, branches, functions, regions, MC/DC and instantiations. Because it's a harmonic mean, a weak metric can't be masked by a perfect one. Weights default to IEC 61508 / ISO 26262 / DO-178C-aligned tiers, and the COMPLIANT / NON-COMPLIANT verdict is driven by per-metric thresholds plus a configurable mode.
 Screenshot pending — add assets/img/statusbar.png (see SCREENSHOTS.md).
In-editor analysis
- Function CodeLens — per-function coverage %, click to jump to its first uncovered line.
- Branch & MC/DC hover — per-arm taken/not-taken counts and per-decision condition/vector breakdowns; optional coloured MC/DC margin gutter.
- Dead-code warnings — Problems-panel warning for functions with measurable lines and zero coverage.
- Next/Previous Uncovered navigation.
- Mismatch warning when a file's contents no longer fit its run — kept current as files are saved or change on disk, with the exact difference in the hover.
- Since last run — a red triangle on every line executed in the previous run and not in this one, a green one for the reverse, with the overview ruler and the hit counts on hover.
- Edited buffers — every mark, hover and CodeLens moves with the text as you edit, and withdraws from a rewritten line, where a grey dot says why.
- Editor gutter modes —
editorGutter.modekeeps the gutter to findings (off), puts a bar on every line that never ran and an amber one where a branch arm was never taken (uncovered), or adds a warm shade on every executed line, hotter the more often it ran (heatmap); Choose Editor Gutter Mode... switches from the palette or the status-bar menu. - Inline hit counts —
hitCounts.inlinewrites×12after each line a statement starts on,×0included; Toggle Inline Hit Counts flips it. - Per-line Problems entries —
problems.perLineputs an Information diagnostic on every block of lines that never ran in an open document (a dead function is one entry, not forty), and optionally on every line with a branch arm never taken; the entries follow their lines as you edit. - Line tint and scrollbar map —
lineHighlightputs a translucent wash behind the lines themselves rather than (or as well as) a mark in the gutter, andoverviewRulerdecides the scrollbar stripe on its own: with the gutter off, that is a map of the file's gaps down the scrollbar and nothing at all beside the code. - Which tracefile covered this line — with several reports merged, the hit-count hover names every one that covered the line (lcov's
TN:suite name included), and clicking a tracefile row in the Coverage view lights the lines it contributed.
- Red, amber and green — the
coveragemode ofeditorGutter.modeandlineHighlightpaints every measured line in the colour scale's colours; the status-bar mode button andAlt+Gmove from one mode to the next. - Your colours, previewed — the colour scale and the heatmap's shades (
heatmap.colors,heatmap.colorsDark) are settings, and the settings page previews them on a light and a dark editor as they are picked. - Which report a file comes from — with two reports measuring the same code,
coverageFile.sourcesrules, or Choose Coverage Source for This File..., decide which one each file shows instead of the newest winning.
Reporting & history
- Generate Full HTML Report — a self-rendered, multi-page, per-directory report; Open Annotated Source for a single file.
- Optional local run history with a coverage trend (▲/▼), plus Compare Two History Runs and Compare with Last Run.
- Show Worst-Covered Files / Functions and Copy Uncovered Lines (Markdown).
- Export Fucini JSON — the full normalised model.
- Export Coverage Report... — the same run as CSV (per file or per function), a Markdown summary, an LCOV tracefile, Cobertura XML, SARIF, or a self-contained SVG badge. With twenty-five readers and these writers the extension converts between formats: load JaCoCo or llvm-cov JSON, emit the LCOV that Codecov, Coveralls and SonarQube read, or the Cobertura XML that Jenkins, GitLab and Azure DevOps ingest.
- Generate Coverage Badge — a shields-style SVG written straight into the workspace (
badge.outputPath, defaultcoverage-badge.svg) for a README to embed withand no hosted service;badge.metricpicks lines, branches, MC/DC or the composite score, the colour follows thecolorScale.*tiers, andbadge.autoUpdaterewrites it after every load.
 Screenshot pending — add assets/img/report.png (see SCREENSHOTS.md).
 Screenshot pending — add assets/img/annotated-source.png (see SCREENSHOTS.md).
Community and Pro, feature by feature
Two listings, one codebase. Community is the permanently free tier, and what the Pro listing settles onto after its 14-day trial; Pro and the trial are everything, uncapped. The line is drawn so the free tier always sees every finding and pays only for convenience, proof and scale — inside VS Code, Fucini Coverage: What Community Includes shows the same list with today's counts against each cap.
| Capability | Community (free) | Pro, and the trial |
|---|---|---|
| All 25 formats, multi-file merge, path remapping | ✓ | ✓ |
| Gutters, overview ruler, Explorer badges, Coverage view, CodeLens, hovers | ✓ | ✓ |
| Watch mode with automatic reload; Run Tests with Coverage | ✓ | ✓ |
| Diff coverage, history and trend, since-last-run marks | ✓ | ✓ |
| Loading coverage by command | 25 a day (automatic loads are not counted) | unlimited |
| Compare runs, Check Coverage Thresholds, Open HTML Report, Export Coverage Report, Export Fucini JSON | 5 a week each | unlimited |
| Annotated Source, in place | 5 a week | unlimited, plus a persistent side pane and Generate Full HTML Report |
| Export Coverage Report | CSV (per file, per function) | also Markdown, LCOV, Cobertura XML, SARIF, SVG badge |
| A file that no longer matches its coverage | reported and dimmed | also the line, function or checksum that proved it |
| Surviving mutants | marked on the line, with how many | also what each mutant changed |
| Tests that ran a line | how many | also their names |
| CRAP | Max CRAP of the run, CRAP on every function | also the ranked Riskiest Methods list |
| Risk hotspots | how many, and the worst score | also the ranked list, each opening its function |
| MC/DC coverage, gutter bars and hover | — | ✓ |
| Object-code coverage scored and gated | its presence is announced | ✓ |
| A file measured by several reports | the newest report | also choose one per file, or combine them (agree / union) |
| Telemetry required | no — optionally, and once per machine, Unlock Full Features trades detailed usage telemetry for 30 days of everything in the right column | no |
A week runs seven days from the first use that opened it, and nothing that only reads coverage is counted. Not ready for a subscription? A 7-day pass is everything in the right column for one week, paid once, with nothing to cancel.
VS Code and Visual Studio, side by side
One product, two editors, one reader: the same report gives the same numbers, to the digit, in both. Coverage Studio for Visual Studio runs on Visual Studio 2022 and 2026 — Community, Professional and Enterprise and does not use Visual Studio's own code coverage, which in 2022 is Enterprise-only; it is included with every paid plan, and a device with both editors is one seat. Everything above the line is in both; below it, what Visual Studio has no counterpart for, and what is still to come there.
| Capability | VS Code | Visual Studio |
|---|---|---|
All 25 formats, multi-file merge, path remapping, the same fuciniCoverage.* settings and .vscode/settings.json | ✓ | ✓ |
| Gutters, overview ruler, hit counts, per-function lens, hovers, the Coverage view, the status bar and its cards | ✓ | ✓ |
| Watch mode with automatic reload; Next Uncovered, Next Partly-Tested Decision; copy as Markdown | ✓ | ✓ |
| Composite score, thresholds and the COMPLIANT verdict; MC/DC; CRAP | ✓ | ✓ |
| Getting Started, in 18 languages | a walkthrough | a page under Tools → Coverage Studio |
| Run Tests with Coverage, Run This Test with Coverage, coverage after every save; the editor's own Test Coverage panel | ✓ | ✓, and Collect Coverage in Test Explorer… — the Test Coverage panel is a VS Code API |
| Explorer badges | ✓ | — (Solution Explorer cannot decorate files) |
| Annotated Source, HTML report, exports, Check Thresholds, Error List, history and trend, diff coverage | ✓ | ✓ |
| Which tests ran a line, exclude from the tree and from the editor, the namespace perspective and the search box, coverage sessions, the trend chart, the CI baseline | ✓ | ✓, plus Run Native Project with Coverage for a C++ project |
| Free tier, trial, checkout | ✓ | — (a paid plan; the key is found on a machine where VS Code is activated) |
Coming next: all of this coverage in Azure DevOps, as a free extension. Azure DevOps shows coverage on a build only as far as its own format goes — lines, and branches as a percentage. Fucini DevOps Studio will show the whole of what Coverage Studio reads: every one of these 25 formats, for every language, with MC/DC, conditions, the composite score and the gates, as a Coverage tab on the pipeline that produced it. Follow the news for the first release.
Settings reference
Configure in the Settings UI (search Fucini Coverage) or in settings.json.
Download the complete settings reference — a commented settings.json holding every fuciniCoverage.* setting at the same default the packaged extension uses, ready to copy into your workspace or user settings. Regenerated from the extension on every release, so it cannot drift from what the VSIX ships.
A row ending in Per folder. takes a folder-level value in a multi-root workspace: each folder is discovered with its own .vscode/settings.json or .code-workspace entry, and ${workspaceFolder} in it means that folder.
Localization
| Setting | Default | What it does |
|---|---|---|
language | auto | Pin this extension's own runtime UI (status bar, notifications, tooltips, license & report webviews) to a specific language, independent of VS Code's overall Display Language. auto follows VS Code. One of auto, en, uk, nl, de, fr, es, hr, pl, it, pt, ru, tr, he, ja, zh, hi, ko, ar. Does not change Command Palette entries or the Settings UI's own labels/descriptions — VS Code resolves those from its Display Language. |
Discovery & loading
| Setting | Default | What it does |
|---|---|---|
coverageFile.defaultLocation | "" | Base folder for discovery and file-pick dialogs. Variables: ${workspaceFolder}, ${workspaceFolderBasename}, ${userHome}, ${env:NAME}, ${command:id}, ${config:section.key}. Per folder. |
coverageFile.paths | [] | Tracefile(s) to load & merge, relative to the base folder, absolute (the same variables as above), or an http(s):// URL fetched on every load — add #lcov.info (or another file name) as the URL fragment when the URL itself has no extension. A relative * glob recurses under the base folder; an absolute entry may hold a wildcard too (${workspaceFolder}/build/coverage-merged/*.lcov.info, ** for any depth), searched under the folders before it. Per folder. |
watch.enabled | true | Reload coverage when a tracefile changes — or appears, for an absolute entry outside the workspace. Per folder. |
watch.reloadAfterTasks | [] | Task names (label, or source: name like npm: test) whose ending reloads coverage, whether or not watch.enabled is on. Per folder. |
remote.headers | [] | Name: value headers sent with every URL fetch; variables expand, so Authorization: Bearer ${env:CI_TOKEN} keeps the token out of settings.json. Per folder. |
remote.refreshMinutes | 0 | Re-fetch URL entries every N minutes (conditional GET; 0 = only on load). Per folder. |
baseline.report | "" | The report to hold every loaded run against — the main branch's, as the build server publishes it: a URL, fetched with remote.headers and cached as a coverageFile.paths URL is, or the path of a downloaded artifact, absolute or relative to the folder. The status bar's card then says where this run stands against it, and Compare with CI Baseline lists the files that moved. Empty: no baseline. Per folder. |
Colour scale & badges

| Setting | Default | What it does |
|---|---|---|
colorScale.preset | default | colorblind swaps red, amber and green for vermillion, orange and blue (Okabe–Ito) everywhere coverage is coloured; colours you changed below keep precedence. |
colorScale.lowColor | #8b1a1a | Low end of the coverage gradient. |
colorScale.midColor | #b8860b | Pivot colour of the gradient. |
colorScale.highColor | #228b22 | High end (100%) of the gradient. |
colorScale.lowThreshold | 80 | % at which the badge steps low → mid. |
colorScale.highThreshold | 90 | % at which the badge steps mid → high (and gradient pivot). |
heatmap.colors | ["#fff1a8", …, "#a63603"] | The heatmap's five shades on a light theme, from the line that ran least to the line that ran most. |
heatmap.colorsDark | ["#6e5f22", …, "#ff6a00"] | The same for a dark theme, where brighter reads as more. |
Composite score (Weighted Harmonic Mean)
| Setting | Default | What it does |
|---|---|---|
whmWeights.lines | 1 | Weight for line/statement coverage. |
whmWeights.functions | 1 | Weight for function coverage. |
whmWeights.regions | 1.5 | Weight for region coverage (llvm-cov). |
whmWeights.branches | 2 | Weight for branch coverage. |
whmWeights.mcdc | 4 | Weight for MC/DC coverage. 0 excludes it. |
whmWeights.instantiations | 0.5 | Weight for C++ template instantiations (llvm-cov). |
Thresholds & compliance
| Setting | Default | What it does |
|---|---|---|
threshold.profile | standard | standard sets the defaults below; safety puts every gate at 100 bar the mutation score; custom leaves whatever you have set. In the default profile the safety metrics are ungated — a project that does not measure MC/DC is not failed for it. |
threshold.statement | 80 | Minimum statement %. 0 disables the gate. |
threshold.branch | 70 | Minimum branch %. |
threshold.mcdc | 0 | Minimum MC/DC %. |
threshold.functions | 80 | Minimum function %. |
threshold.regions | 75 | Minimum region % (llvm-cov). |
threshold.instantiations | 0 | Minimum instantiation % (llvm-cov); C-only projects are skipped. |
threshold.conditions | 0 | Minimum condition %. |
threshold.functionCalls | 0 | Minimum function-call %, where the report carries it. |
threshold.objectCode | 0 | Minimum object-code %, where the report carries it. |
threshold.mutation | 0 | Minimum mutation score, where a mutation report is loaded. |
threshold.weighted | 75 | Minimum composite score. |
compliance.mode | strict | strict | whm | both | either. |
compliance.diagnostics | false | One Problems error per failing threshold, on the tracefile. |
threshold.unmeasuredFiles | -1 | Maximum number of unmeasured files (needs unmeasured.mode set to list or count). -1 does not check; 0 fails on the first file no test loaded. |
problems.perLine | off | off | uncovered | uncoveredAndPartial: an Information entry (a squiggle in the editor) per block of consecutive uncovered lines in each open document, optionally plus one per line with a branch arm never taken. Independent of problems.enabled. Per folder. |
Diff, remap & reports
| Setting | Default | What it does |
|---|---|---|
pathRemap | [] | Ordered {from,to} path rewrites; to may use ${workspaceRoot}, which tries the tracefile's own folder first and then every other folder of the workspace. When a load leaves files unmatched, the load result offers Apply Suggested Remap with the rule inferred from the unmatched paths (also Suggest Path Remap Rule in the palette); nothing is written until you click it. Per folder. |
ignore | [] | Glob patterns for whole files to leave out of the run (vendor/**, **/*.generated.ts, build/**) — dropped at load, so every view, gate and export counts without them. Matched against the workspace-relative and the absolute path; a pattern with no / matches a name at any depth, like .gitignore. Per folder. |
ignore.generated | true | Leave generated .NET files out of every total, page and export — *.Designer.cs, *.g.cs, *.g.i.cs, *.generated.cs, *.razor.g.cs, *.AssemblyInfo.cs, GlobalUsings.g.cs, Migrations/** and obj/** — before ignore is applied. Off for a project that tests its migrations. Per folder. |
ignore.namespaces | [] | Namespaces to leave out of every total and every page, for .NET sources: a file whose namespace declaration matches one of these is not counted. A prefix with * as a wildcard — Acme.Generated, Acme.*.Migrations, *Tests. Per folder. |
ignore.attributes | ["ExcludeFromCodeCoverage"] | Attributes that take a .NET class, method or property out of the count, read off the source: the member below one of these is excluded as LCOV_EXCL_START/STOP would exclude it, whatever tool wrote the report. Names with or without the Attribute suffix, with or without a namespace; add GeneratedCode, Obsolete or your own. Per folder. |
testRun.perTest | false | Run Tests with Coverage runs a dotnet test recipe one test class at a time and tags each report with its class, so the hover, the CodeLens and Show Tests That Ran This Line can say which tests ran a line — slower, and only for .NET, whose Cobertura report cannot say by itself. Per folder. |
testRun.onSave | false | Saving a source runs the tests that cover it, with coverage, a moment after the save: for a .NET solution only the test projects that reference the saved file's project, one dotnet test each; any other runner its whole recipe. Several saves are one run; a run already going is not interrupted. Per folder. |
testRun.skipWhenTestsFail | false | Run Tests with Coverage leaves the coverage on screen as it was when the runner exits with a failure, and says so in the Output pane — a red run does not paint a green file red. Per folder. |
unmeasured.mode | off | off | list | count: what to do about workspace files of the run's kind that no test loaded (see Unmeasured versus uncovered). list names them in the Coverage view and the load result; count also scores each as an uncovered file of its code lines. Changing it reloads. |
unmeasured.exclude | ["**/*.h", "**/*.hpp", "**/*.hh", "**/*.inl", "**/*.d.ts"] | Files never called unmeasured, in ignore's glob syntax — header-only and declaration-only files by default. Per folder. |
hotspots.crapThreshold | 30 | A function with this CRAP score or more is a risk hotspot, listed under the tree of the Coverage view, worst first — 30 is the figure the metric's authors proposed. Only reports that carry cyclomatic complexity have any. Per folder. |
hotspots.complexityThreshold | 0 | A function this complex or more is a hotspot too, whatever its coverage; 0 turns it off. Per folder. |
gitDiff.enabled | false | Restrict coverage to lines changed vs a base ref. Per folder. |
gitDiff.baseRef | origin/master | Git base ref for diff coverage. Per folder. |
externalHtmlReport.dir | "" | Read a pre-built llvm-cov show HTML dir for Annotated Source. Per folder. |
htmlReport.outputDir | "" | Output dir for Generate Full HTML Report. Per folder. |
badge.outputPath | coverage-badge.svg | Where Generate Coverage Badge writes the SVG — relative to the workspace folder or absolute, same variables as coverageFile.defaultLocation; parent folders are created. Per folder. |
badge.metric | lines | lines | branches | mcdc | weighted: the run-wide number on the badge (weighted is the status bar's composite score). No data for it → a grey n/a. Per folder. |
badge.autoUpdate | false | Rewrite the badge after every successful load, silently (logged as [FUCINI_BADGE]). Per folder. |
Display & analysis
| Setting | Default | What it does |
|---|---|---|
mcdcGutter.enabled | false | Coloured MC/DC margin gutter. |
statusBar.enabled | true | Show run-wide & per-file status-bar items. |
statusBar.showLauncher | true | Always-available quick-menu launcher. |
statusBar.showModeToggle | true | A status-bar button naming the gutter mode; a click moves it on by one. |
codeLens.enabled | true | Per-function coverage CodeLens. |
deadCode.enabled | true | Warn on zero-coverage functions. |
staleWarning.enabled | true | Mark files whose contents no longer match their run. |
explorerBadges.enabled | false | Coverage badges and hover next to files in the Explorer. |
coverageFile.rememberPicks | true | Write every picked file into coverageFile.paths. |
coverageFile.sources | [] | Which loaded report a file's numbers come from when more than one measures it: ordered { "files": glob, "report": glob } rules, the first that matches deciding. With "combine": "union" (covered where any report ran a line) or "agree" (only where every report did, disagreements in teal) the matching reports are combined. Paid plans. Per folder. |
coverageFile.mergeStrategy | newest | For files no rule decides: newest (the report written last wins) or order (the later entry in coverageFile.paths wins, whatever the times). Per folder. |
sinceLastRun.enabled | true | Gutter marks on lines whose coverage changed since the previous run. |
dirtyMarks.enabled | true | Grey gutter dot on lines edited since the run was loaded. |
editorGutter.mode | off | off | uncovered | coverage | heatmap: nothing beyond the findings above, bars on uncovered (and partially covered) lines only, those plus a green bar on every covered line, or those plus a warm shade on every executed line by hit count. Per folder. |
lineHighlight | off | off | uncovered | coverage | heatmap: a translucent wash behind the line itself, for what the gutter marks. Its own setting, so the gutter can stay clean while the gaps are tinted, or the other way round. Per folder. |
overviewRuler | follow | follow | uncovered | off: whether uncovered lines get a stripe in the scrollbar's overview ruler. uncovered paints it even with the gutter off — a map of the file's gaps down the scrollbar and nothing beside the code; off keeps the bars and drops the stripe. Per folder. |
hitCounts.inline | false | ×N after every line a statement starts on, ×0 included. Per folder. |
testCoverage.publish | true | Publish every loaded run to VS Code's own Test Coverage view (Test Explorer panel, Explorer percentages, Show Inline Coverage). Off: no Fucini Coverage entry in the Test Explorer; Show in Test Coverage View still publishes on request. |
coverageView.perspective | folders | Which tree the Coverage view shows: the workspace's folders and files, or — for a .NET report that names its classes (Cobertura, Coverlet, OpenCover) — namespaces, classes and methods, each with its own numbers. The dropdown in the view writes this; it is only offered when the run carries class names. |
coverageView.mergedMarks | true | With several tracefiles loaded: outline the tracefile badge on every file whose numbers overruled an older report, and let a click on a tracefile row highlight the files it measured. Off: plain badges, no highlight; the tracefile rows still count what was overruled. |
excludeComments | true | Exclude comment/blank & LCOV_EXCL_* lines, and preprocessor directives in C, C++, Objective-C, CUDA and C#. |
excluded.includeInTotals | false | Count excluded lines toward totals. |
History
| Setting | Default | What it does |
|---|---|---|
history.enabled | false | Store runs locally for trend & comparison. |
history.retention | 20 | Max stored runs to keep. |
Status-bar quick actions
All default false except the last two; enable to add the matching action to the quick menu: quickActions.compareWithLastRun, openAnnotatedSource, openAnnotatedSourceToSide, toggleAnnotatedSource, toggleWatch, worstCoveredFiles, worstCoveredFolders, worstCoveredFunctions, nextUncovered, previousUncovered, checkThresholds, copyUncoveredLines, compareHistoryRuns, exportJson, exportReport, generateBadge, showTestCoverage, chooseGutterMode, toggleInlineHitCounts.
Telemetry
| Setting | Default | What it does |
|---|---|---|
telemetry.enabled | false | Usage telemetry, off by default. On the Community tier, Unlock Full Features trades it for every Pro feature, MC/DC included, for 30 days, once per machine; a paid licence is unaffected by it. See the privacy policy for what is sent. The daily summary and removal notice are also gated by VS Code's own telemetry.telemetryLevel; the install ping and a few small lifecycle events are not. |
Updates
| Setting | Default | What it does |
|---|---|---|
update.checkForUpdates | true | Periodically check both fucini.software and the VS Code Marketplace for a newer release, and offer to install whichever is newer. |
Licensing
| Setting | Default | What it does |
|---|---|---|
license.key | "" | Activation key for the evaluation pre-release (an FCK1.… string). Bound to this machine/user; may carry an expiry and per-feature limits. See Evaluation & activation. |