1. Introduction
Fucini Coverage Studio turns the coverage tracefiles your build already produces into first-class, in-editor coverage inside VS Code and inside Visual Studio. It reads twenty-five formats, normalises them into one canonical Fucini model, merges multiple runs deterministically, and reports it in the editor itself — gutters, CodeLens, hover and a Covered Files view — so there is no separate viewer to leave your editor for. The two editions share one reader: the same report gives the same numbers, to the digit, in both. This guide is written from VS Code; where Visual Studio differs, an In Visual Studio box says how.
It is built with functional-safety workflows in mind: MC/DC coverage, region and C++ instantiation coverage, a safety-weighted composite score, and a configurable COMPLIANT / NON-COMPLIANT verdict aligned to IEC 61508, ISO 26262 and DO-178C thinking.
 Screenshot pending — add assets/img/marketplace-demo.gif (see SCREENSHOTS.md).
2. Install & requirements
- VS Code ≥ 1.88 — the minimum version this extension supports — or Visual Studio 2022 or 2026, Community, Professional or Enterprise (see the box below).
- A coverage tracefile your project already produces (see §4).
Install from the Marketplace, or from a .vsix via Extensions → ⋯ → Install from VSIX…. The extension activates on startup and adds a Coverage icon to the activity bar.
In Visual Studio. The same product ships as a second extension, Fucini Coverage Studio for Visual Studio, for Visual Studio 2022 and 2026 — Community, Professional and Enterprise. It does not use Visual Studio's own code coverage: in Visual Studio 2022 that is an Enterprise feature, so on Community and Professional this is the only coverage the IDE will show. Install the .vsix by opening it — the VSIX Installer asks which Visual Studio — or through Extensions → Manage Extensions; the extension loads when a solution or a folder opens. The Coverage window needs the Microsoft Edge WebView2 Runtime, which Windows 11 and Visual Studio 2026 already bring; the marks in the editor work without it.
3. Quick start
Want to see it working before wiring up your own project? Download the demo project (~6 KB — a tiny C project with a ready-made lcov.info):
- Unzip it anywhere, then open
coverage-studio-demo.code-workspacein VS Code (File → Open Workspace from File…). - Install Fucini Coverage Studio if you haven't already (see §2 above).
- The workspace's own
.vscode/settings.jsonalready points at the bundledcoverage/lcov.info, so gutters and the Covered Files view appear as soon as the extension activates — noLoad Coveragestep needed. - Want to regenerate the tracefile yourself (e.g. with a different compiler)? Run
scripts/gen-coverage.sh(or.ps1on Windows) — see the workspace's ownREADME.mdfor the available compiler targets.
In Visual Studio. Open a solution, or a folder (File → Open → Folder, which is how a CMake project is opened) — the demo above opens as a folder, and its .vscode/settings.json is read there too. A report in the place the settings name is loaded by itself and the Fucini Coverage pane of the Output window says which files; otherwise Tools → Coverage Studio → Load Coverage File…, once — it is remembered. Open a source file and choose Show Coverage in Editor: red is a line that never ran, amber a decision taken only one way, and Ctrl+Shift+U, N walks to the next uncovered line. View → Other Windows → Coverage is the tree with every file's numbers and one score over all of them, which the status bar shows for the run and for the file you are in. Tools → Coverage Studio → Getting Started opens these steps as a page with a button for each; it opens by itself the first time.
- Generate a coverage tracefile with your normal test workflow.
- Command Palette (
Ctrl+Shift+P) →Fucini Coverage: Load Coverage. Withwatch.enabledon (the default), a matching file loads automatically. - Open a covered source file: the status bar shows its percentage, the Coverage view fills in, hovering a line shows its hit count, and the run appears in the native Test Coverage panel. Bars on uncovered lines, a hit-count heatmap and inline
×Ncounts are a setting away (editorGutter.mode,hitCounts.inline).
 Screenshot pending — add assets/img/gutters.png (see SCREENSHOTS.md).
4. Producing tracefiles
Any of the following are auto-detected on load:
Full copy-paste recipes per compiler — including Swift, Rust, Go, Python, .NET, PHP and more — live on the Coverage Recipes page: Swift · Clang · GCC · Rust · Go · Python · Java/Kotlin · JS/TS · .NET · PHP · Ruby.
C / C++ — LLVM (llvm-cov)
clang --coverage -fprofile-instr-generate -fcoverage-mapping test.c -o test
LLVM_PROFILE_FILE=test.profraw ./test
llvm-profdata merge -sparse test.profraw -o test.profdata
llvm-cov export ./test -instr-profile=test.profdata --format=json > coverage.json
llvm-cov JSON is the richest input — it carries regions, MC/DC and C++ template instantiations in addition to lines, branches and functions.
C / C++ — GCC (gcov → lcov)
gcc --coverage calc.c calc_test.c -o test && ./test
lcov --capture --directory . --output-file lcov.info
# or gcovr --cobertura coverage.xml
# or skip the conversion entirely: gcovr --json coverage.json
JavaScript / TypeScript — Istanbul / nyc
nyc --reporter=json mocha # emits coverage/coverage-final.jsonJava — JaCoCo
mvn test # emits target/site/jacoco/jacoco.xmlRuby — SimpleCov
# .resultset.json (built-in) or coverage.json via the simplecov-json gemGo
go test ./... -coverprofile=coverage.out # read directly, no conversionPython — coverage.py
coverage run --branch -m pytest && coverage json # emits coverage.jsonPHP — PHPUnit (Clover)
XDEBUG_MODE=coverage phpunit --coverage-clover clover.xml.NET / C# — Coverlet (OpenCover)
dotnet test /p:CollectCoverage=true /p:CoverletOutputFormat=opencoverOn the Microsoft Testing Platform — xunit.v3 with UseMicrosoftTestingPlatformRunner, MSTest.Sdk, the NUnit and MSTest runners, TUnit — a test project is a program of its own, and on the .NET 10 SDK dotnet test will not start one at all. Run Tests with Coverage sees the platform in the project file and runs each such project as the program it is, with the platform's own flags: dotnet run --project tests/App.Tests/App.Tests.csproj -- --coverage --coverage-output-format cobertura --results-directory <folder>/coverage/App.Tests. --coverage comes from the Microsoft.Testing.Extensions.CodeCoverage package (MSTest.Sdk brings it) — the recipe names the package when no project has it; with Microsoft.Testing.Extensions.TrxReport the run also writes test-results.trx beside the report, so failing tests are marked as for a VSTest run. The report the platform names after a GUID is renamed to coverage.cobertura.xml after the run, as Microsoft's collector's is, so one run's report replaces the last one's. A solution that mixes platform and VSTest test projects runs each its own way, in both editors.
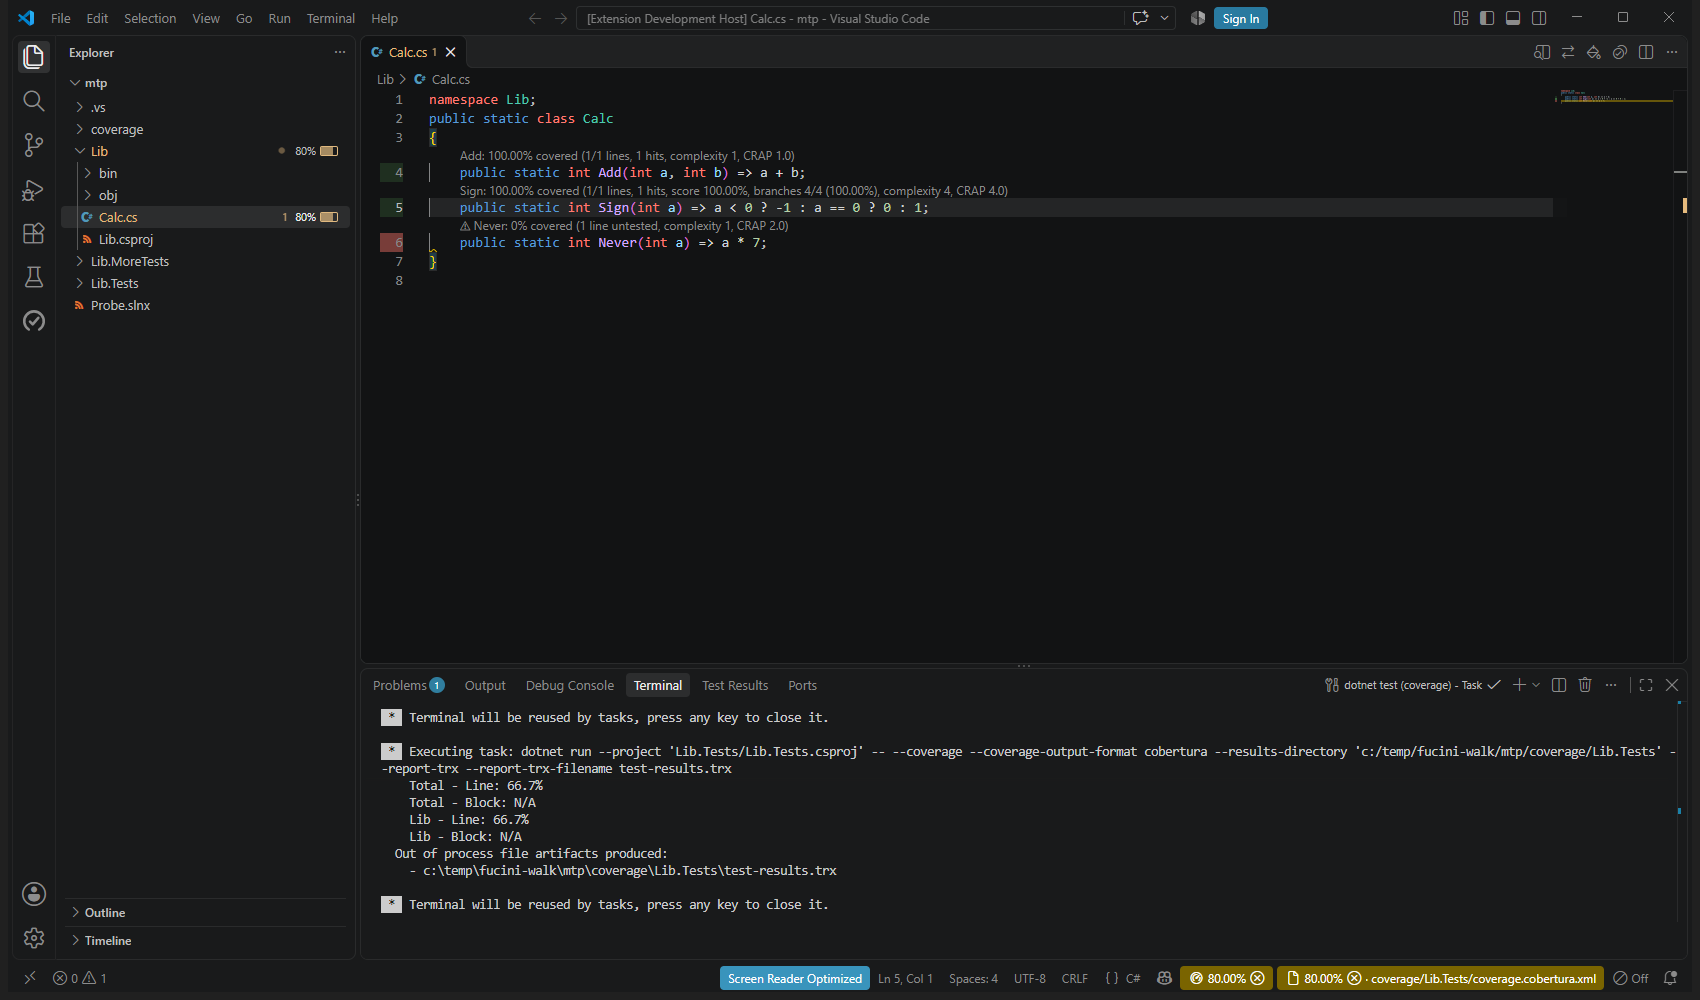 Screenshot pending — add assets/img/mtp-run.png (see SCREENSHOTS.md).
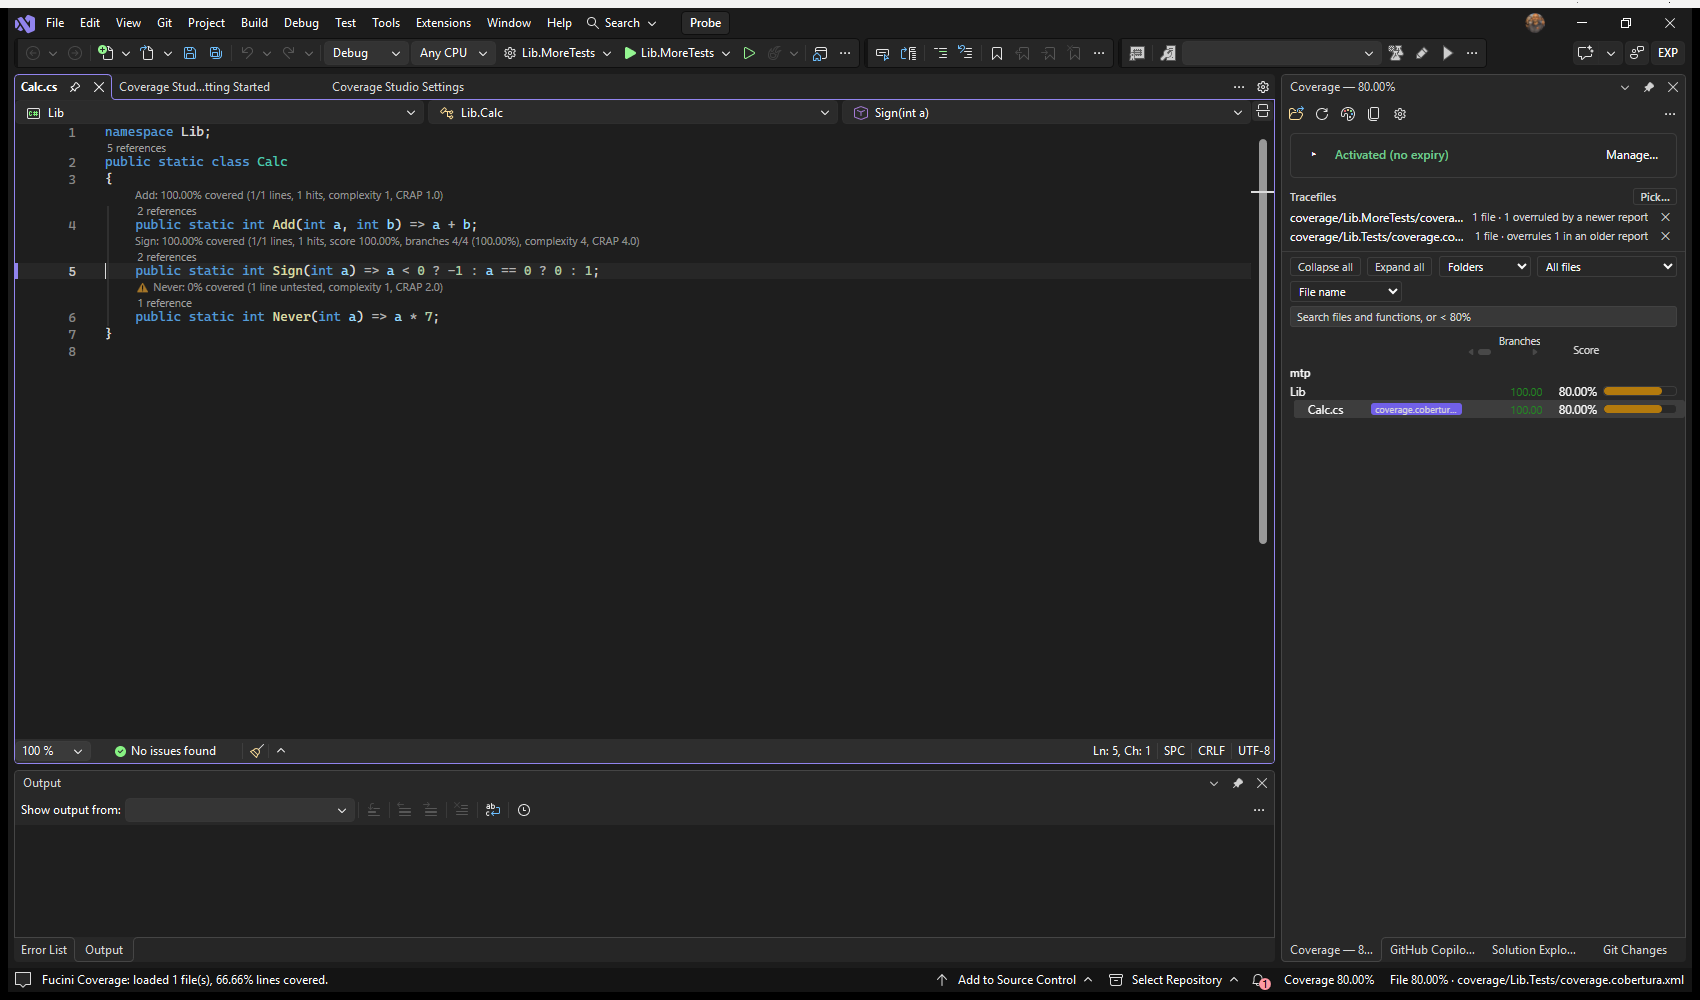 Screenshot pending — add assets/img/vs-mtp-run.png (see SCREENSHOTS.md).
coverage.cobertura.xml.| Format | Typical file | Extra metrics |
|---|---|---|
| LCOV | lcov.info | lines, branches, functions |
| llvm-cov JSON | coverage.json | + regions, MC/DC, instantiations |
| Cobertura XML | coverage.xml | lines, branches |
| JaCoCo XML | jacoco.xml | lines, branches, functions |
| Istanbul / nyc | coverage-final.json | statements, branches, functions |
| SimpleCov | .resultset.json | lines |
| Clover XML | clover.xml | lines, branches, functions |
| OpenCover XML | coverage.opencover.xml | lines, branches, functions |
| coverage.py JSON | coverage.json | lines, branches |
| gcov / gcovr JSON | coverage.json | lines, branches, functions |
| Go coverage profile | coverage.out | lines |
| SonarQube generic | coverage.xml | lines, branches |
| GNATcoverage XML (Ada) | *.xml | lines, branches, MC/DC |
| BullseyeCoverage XML | coverage.xml | lines, condition/decision |
| Visual Studio | *.coveragexml | lines, branches |
| Coveralls JSON | coveralls.json | lines, branches |
| Xcode xccov JSON | coverage.json | functions and file totals — no per-line data |
| gcov plain text | *.gcov | lines, branches, function calls |
| VectorCAST | coverage.xml | lines, branches, MC/DC pairs, functions, function calls |
| Testwell CTC++ | *.txt | lines, condition/decision |
| Lauterbach TRACE32 | *.xml | statements, decisions, conditions, MC/DC, functions, calls, object code |
| EMMA XML (Java) | coverage.xml | lines |
| UCIS / Aldec UCDB | *.xml | statements, decision branches |
| NCover XML | Coverage.xml | lines, functions |
| dotCover DetailedXML | dotCover.xml | lines, functions |
| PIT (mutation) | mutations.xml | mutation score — contributes no coverage |
| Stryker (mutation) | mutation-report.json | mutation score — contributes no coverage |
A native C++ project, measured from Visual Studio
In Visual Studio. Visual Studio's own coverage of a C++ project was Enterprise-only, and the free OpenCppCoverage plugin that filled the gap was retired. Tools → Coverage Studio → Run Native Project with Coverage takes the startup project — a .vcxproj — asks MSBuild where it builds to and on which toolset, and measures it one of two ways. On the ClangCL toolset, with LLVM's llvm-profdata and llvm-cov on the machine (Visual Studio's C++ Clang tools for Windows component brings them), it builds the project again into coverage\native\ with -fprofile-instr-generate -fcoverage-mapping, through a props file MSBuild is told to import first — nothing in the project changes — runs the program with LLVM_PROFILE_FILE set, merges the profile and exports coverage\native\lcov.info, exact to the region. On any other toolset, with OpenCppCoverage installed, it builds the project as it is — a Debug build has the PDBs — and runs it under OpenCppCoverage, which writes coverage\native\opencppcoverage.xml. Every command goes to the Fucini Coverage pane, and the report is loaded and remembered as a test run's is. A project that cannot be measured is told why and what to install. MSBuild 17.8 (Visual Studio 2022 17.8) or later, for the question it asks.
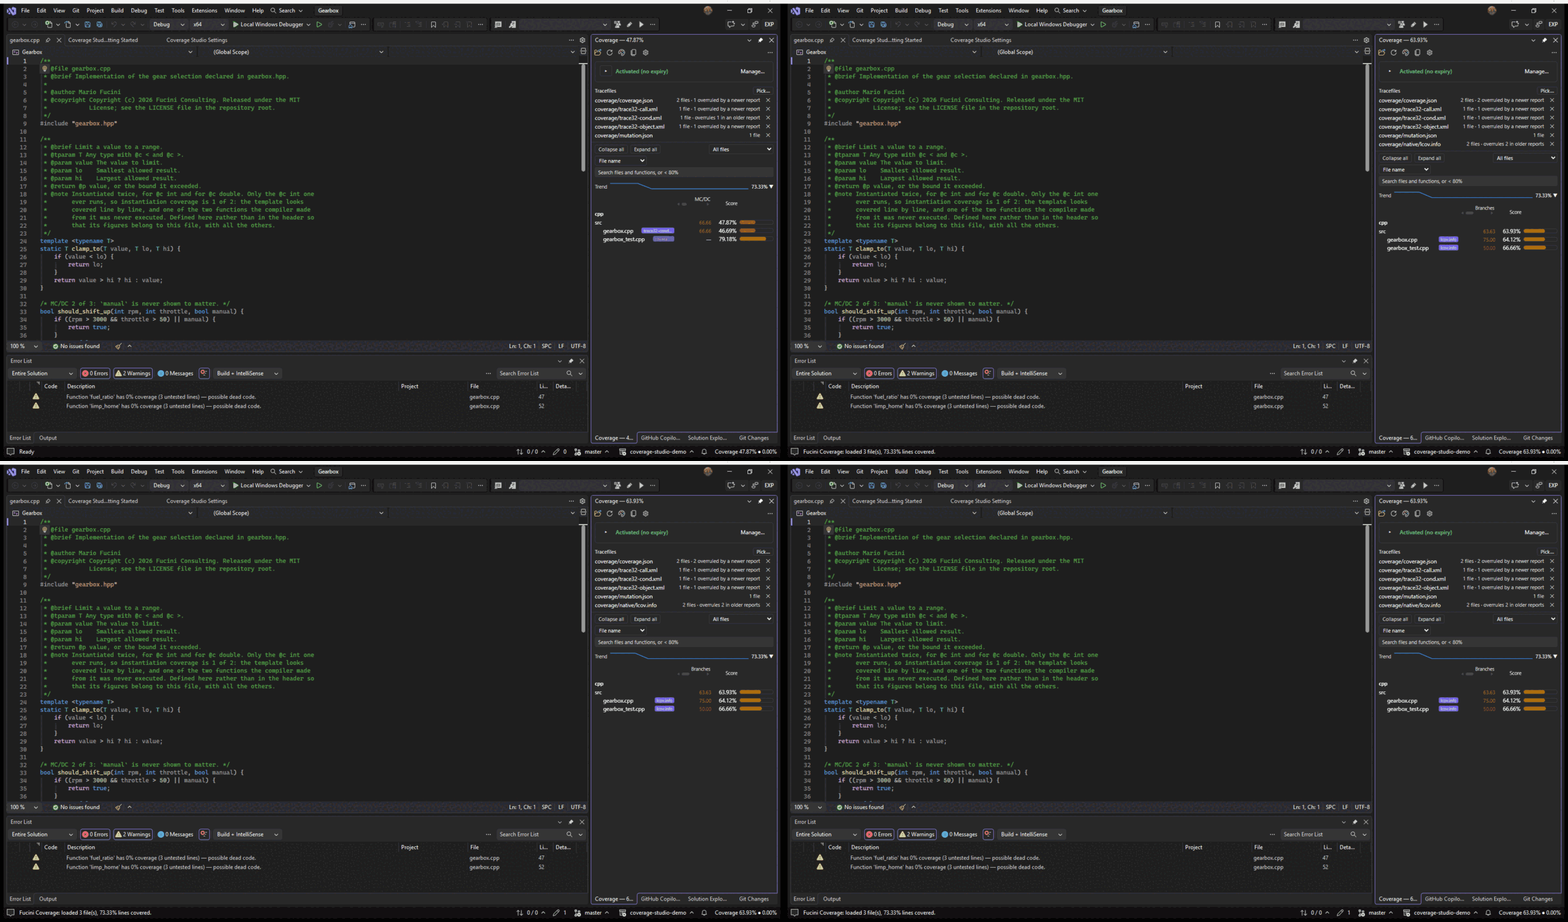 Screenshot pending — add assets/img/vs-native-run.gif (see SCREENSHOTS.md).
5. Loading & discovery
By default the extension scans from the workspace root. Point it more precisely with two settings:
{
  "fuciniCoverage.coverageFile.defaultLocation": "${workspaceFolder}/build",
  "fuciniCoverage.coverageFile.paths": [
    "coverage.json",
    "reports/*.info",
    "${env:CI_ARTIFACTS}/lcov.info",
    "https://ci.example.com/artifacts/latest/coverage.xml"
  ]
}- Each
pathsentry is relative todefaultLocation(or the workspace root when unset). - An entry containing
*is searched recursively; a bare filename matches only directly in the base folder. - When
pathsis empty, the extension looks forcoverage.json, thenlcov.info, loading whichever it finds first. - Pick Coverage File uses the files you pick instead of these paths — each pick adds to the set, and all of them are merged — until you unload them or edit these settings.
- Variables — every path setting expands
${workspaceFolder},${workspaceFolderBasename},${userHome},${env:NAME},${command:id}and${config:section.key}. A variable the extension does not know is left as written, so a typo shows up in the discovery log as the path it looked for rather than vanishing.${command:id}runs that command first — only in a trusted workspace, for at most five seconds — so${command:cmake.buildDirectory}follows the selected CMake kit. - URL entries — an
http(s)://entry is fetched into the extension's storage on every load and loaded from there; the Coverage view names the URL. Each fetch is conditional (ETag / Last-Modified), so an unchanged artifact downloads nothing, and when a fetch fails the last downloaded copy is loaded instead, with the reason in the output.remote.headersaddsName: valueheaders with variables expanded,remote.refreshMinutesre-fetches on a timer, and a#lcov.infofragment names the format when the URL itself does not end in a file name. - Ignore globs —
fuciniCoverage.ignoredrops whole files (vendored, generated, third-party) from the run as it loads, so every view, gate and export counts without them; the load result says how many were left out and the output names them. Patterns match the workspace-relative and the absolute path, and a pattern with no/matches a folder or file name at any depth, like.gitignore. - Multi-root workspaces — every folder is discovered on its own terms:
defaultLocation,paths,pathRemap,ignore,watch.*andremote.*are read per folder, so a folder's own.vscode/settings.jsonor its.code-workspaceentry applies, and${workspaceFolder}in an entry means that entry's own folder. The tracefiles of every folder merge into one run, the Coverage view groups the files by folder, and a folder added to or removed from the workspace reloads coverage by itself. - Reload after a task —
watch.reloadAfterTasksnames tasks (alabelfrom tasks.json, orsource: nameas the Run Task list shows it) whose ending reloads coverage, whether or notwatch.enabledis on — for builds the watcher cannot follow. An absolutepathsentry outside the workspace is polled too, so a file appearing there is loaded. - Progress you can cancel — a load of ten or more tracefiles, or 8 MB or more of them, runs under a progress notification with a Cancel button that names the file being read and the phase; a smaller one only spins the status bar. Cancelling leaves the previous run loaded and says so.
Since 1.2026.6 an absolute entry may hold a wildcard too: ${workspaceFolder}/build/coverage-merged/*.lcov.info loads every such file in that folder, and ** stands for any depth. The folders before the first wildcard are where it looks, and they are watched, so a report a build writes there loads by itself. The Visual Studio edition reads such an entry the same way, and since 1.2026.5 a relative wildcard is searched at any depth there too, as it always was here.
With no paths configured, the first of the well-known report names found under the base folder is loaded. First the four it always looked for — coverage.json, lcov.info, coverage.out, clover.xml — then, since 0.2026.83, jacoco.xml, coverage.xml, cobertura.xml, coverage.cobertura.xml, coverage.opencover.xml and coverage-final.json, and then the places default configurations write to: coverage/ (nyc, Jest, vitest, PHPUnit, SimpleCov), target/site/jacoco/jacoco.xml (Maven), build/reports/jacoco/test/jacocoTestReport.xml (Gradle) and TestResults/*/coverage.cobertura.xml (dotnet test). So a Java or .NET project shows its coverage on first open, as an lcov project always did.
Since 1.2026.3 a .NET solution needs even less: every test project's TestResults/<run>/ folder is among the well-known places, not only the workspace folder's own, and Microsoft's collector's <user>_<machine>_<date>.cobertura.xml is found beside Coverlet's coverage.cobertura.xml — so a solution whose tests were run in Visual Studio's Test Explorer shows its coverage on first open, every run folder loads, and the merge keeps the newest run's word on each file. And fuciniCoverage.ignore.generated, on by default, leaves designer and generated files — *.Designer.cs, *.g.cs, *.generated.cs, *.razor.g.cs, AssemblyInfo, global usings, Migrations/ and obj/ — out of every total, page and export before ignore is applied, so a generated table nobody tests does not cost the solution its gate.
In Visual Studio: a URL, and a project outside the solution folder. An https:// entry in coverageFile.paths is fetched the way the baseline is — the same remote.headers, the same ${env:…}, the same cache — and loaded like a file beside the solution; when the server does not answer, the copy fetched before stands in and the log says so (FUCINI_REMOTE_001). A project the solution lists from a folder beside its own rather than under it — a solution kept in a build folder of its own, say — is searched for reports and watched for new ones as the solution folder is; the project folders are named in the log at load.
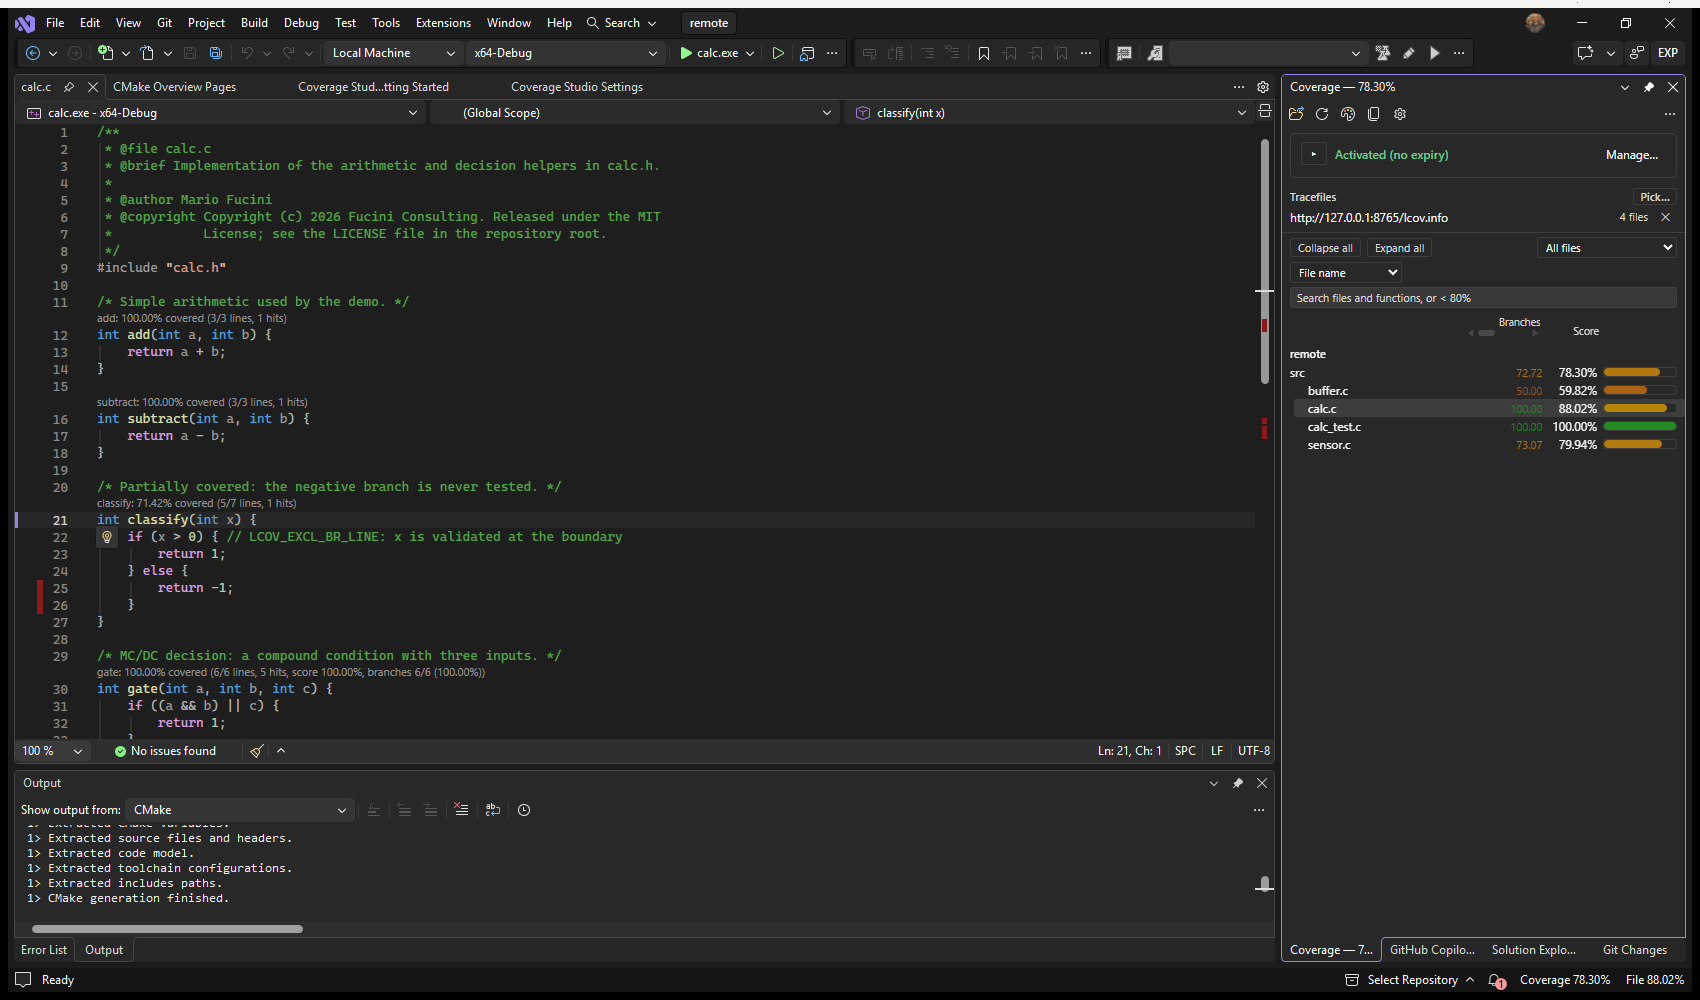 Screenshot pending — add assets/img/vs-remote-tracefile.png (see SCREENSHOTS.md).
In Visual Studio: coverage after every test run. Run your tests as you always do. Tools → Coverage Studio → Collect Coverage in Test Explorer… puts one .runsettings with Microsoft's Cobertura collector beside the solution. Visual Studio picks it up when Tools → Options → Test → Auto detect runsettings files is on; otherwise select it once under Test → Configure Run Settings. From then on every run writes a report under the test project, and the watch on the solution loads it the moment it appears, merged with whatever the settings name — from Test Explorer, a terminal or a script alike. Nothing hooks Test Explorer, so Visual Studio 2026 and Microsoft.Testing.Platform work as they are. Run Tests with Coverage is the VS Code command: it recognises dotnet test, vitest, jest, pytest, go, cargo, maven, gradle, phpunit and ctest, runs the tests with coverage on in the Output window and loads what they wrote; a test project without coverlet.collector is run with the collector the test SDK ships, and testRun.skipWhenTestsFail keeps the last good coverage on screen when a run ends red.
A CI artifact behind a token, re-checked every quarter of an hour — the token stays in the environment, never in settings.json:
{
"fuciniCoverage.coverageFile.paths": [
"https://ci.example.com/api/builds/latest/artifacts/coverage#lcov.info"
],
"fuciniCoverage.remote.headers": ["Authorization: Bearer ${env:CI_TOKEN}"],
"fuciniCoverage.remote.refreshMinutes": 15
}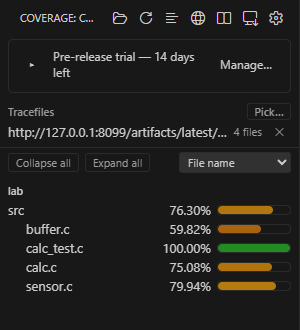 Screenshot pending — add assets/img/remote-tracefile.png (see SCREENSHOTS.md).
A reload is silent on purpose — a dialog after every build is a question with one answer. What is not silent is the Coverage icon: while the view is not in front of you it carries the number of tracefiles that have been read again, and its tooltip names them. Open the view and the count is gone.
 Screenshot pending — add assets/img/coverage-badge.gif (see SCREENSHOTS.md).
Files that should never count, whatever the tracefile says about them:
{
  "fuciniCoverage.ignore": ["vendor/**", "**/*.generated.ts", "build/**"]
}
A reload when the test task ends, for a build the file watcher cannot follow — a run that replaces a symlinked output tree, a report on a network share, a coverage step that post-processes its file:
{
  "fuciniCoverage.watch.reloadAfterTasks": ["npm: test", "coverage-report"]
}
6. Merging runs
Every existing paths entry is loaded and merged into one run. The merge is deterministic — the result does not depend on load order — and a file measured by more than one tracefile takes its numbers from whichever has the newest mtime on disk: a module’s own rerun replaces what a wider, older run said about it rather than adding to it. The Coverage view shows what that did: every file row names the tracefile its numbers came from, the badge is outlined where those numbers overruled an older report, each tracefile row above the tree counts how many of its files were overruled or overruled others, and clicking a tracefile row highlights its files in the tree until it is clicked again (coverageView.mergedMarks turns the outline and the highlight off).
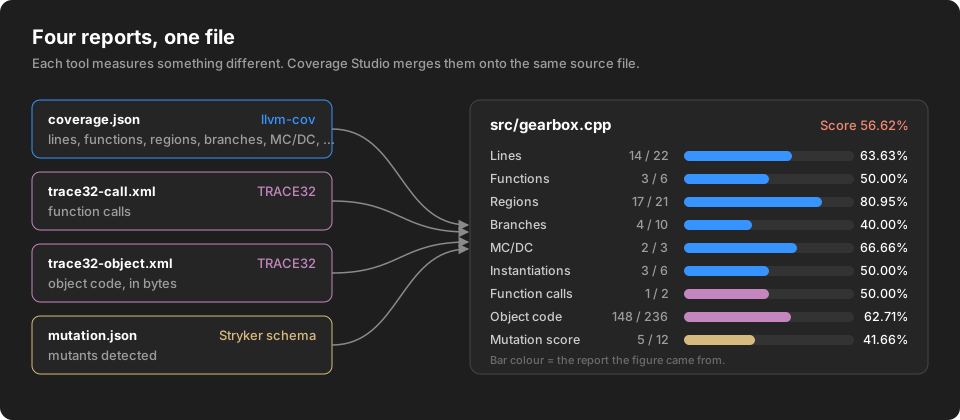 Screenshot pending — add assets/img/four-reports-one-file.svg (see SCREENSHOTS.md).
A merged run can carry more than the six classic metrics, each from the report that measures it: function calls, object code and a mutation score next to lines, functions, regions, branches, MC/DC and instantiations. The Coverage view shows a column for every metric the run carries — and none for one it does not — ordered by the weight each metric carries in your score, heaviest first and at any width: what will not fit scrolls sideways rather than disappearing. Drag the view into the bottom panel and it becomes a table. The status-bar cards, the HTML report and the CSV and Markdown exports follow the same rule: what a report carries is shown, what it does not carry is left out rather than printed as a zero.
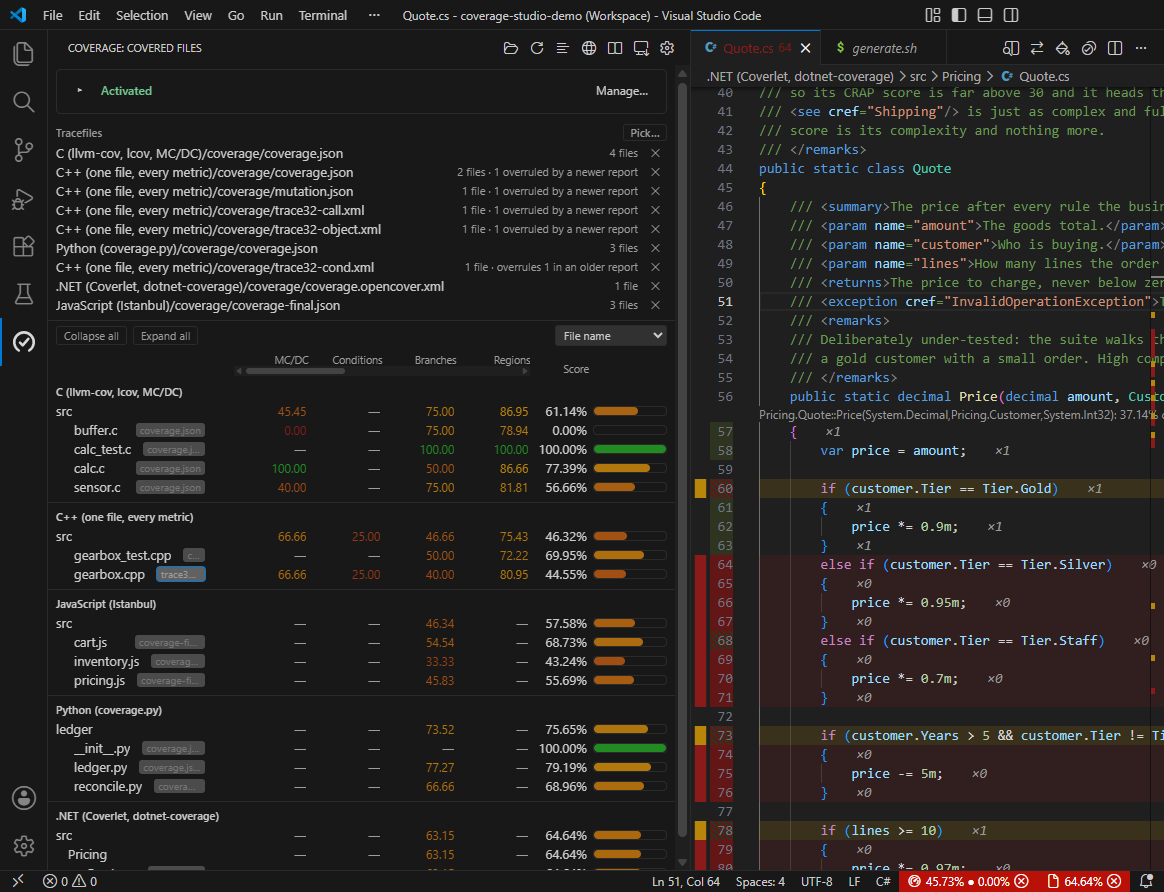 Screenshot pending — add assets/img/coverage-view-editor.png (see SCREENSHOTS.md).
 Screenshot pending — add assets/img/coverage-view-columns.png (see SCREENSHOTS.md).
 Screenshot pending — add assets/img/workspace-overview.gif (see SCREENSHOTS.md).
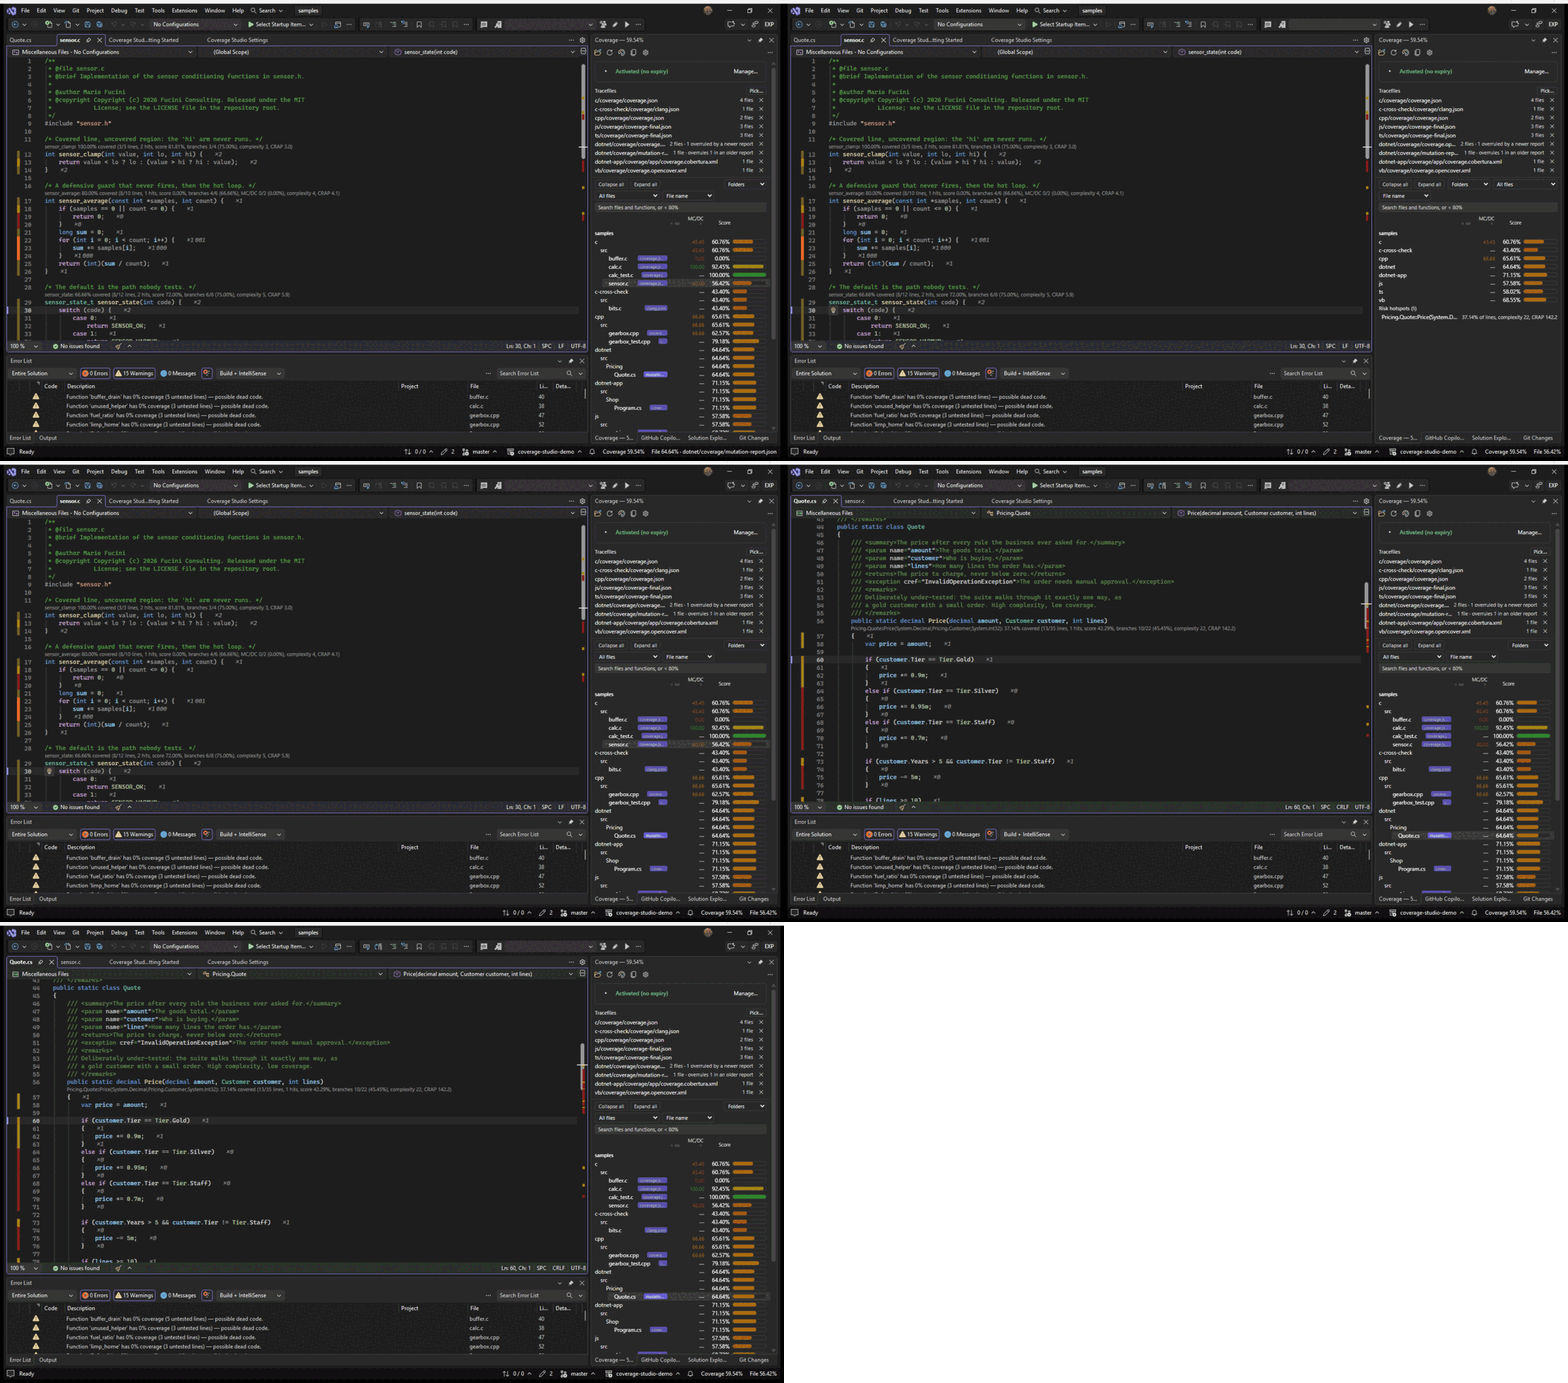 Screenshot pending — add assets/img/vs-workspace-overview.gif (see SCREENSHOTS.md).
Which report a file comes from
When several loaded reports measure the same file, the newest one wins it outright — right when a module's own rerun replaces what an older, wider run said. It is wrong when the reports measure the same code on purpose: then the editor flips between them with every build, and each tells only part of the story. coverageFile.sources says what to do instead, per file. Three situations call for it:
- One report is the better one. llvm-cov's
coverage.jsoncarries MC/DC, a GCCgcov.infoof the same build only lines and branches: pickcoverage.json, and keep the other for the few files only GCC builds. - Several test suites of one build. Unit tests, integration tests and hardware-in-the-loop each write a report; each on its own leaves lines the others ran. Combine, union: a line is covered where any report ran it, and the counts add up.
- One code base, two compilers. The same sources built by clang and by GCC take different paths through toolchain-specific code — an intrinsic here, a portable fallback there — and each report says the other half never ran. Combine, agree: a line is covered only where every report that measures it ran it, and the lines they disagree on are marked in teal. That is the question a cross-compiler check asks: what did every build I ship actually exercise?
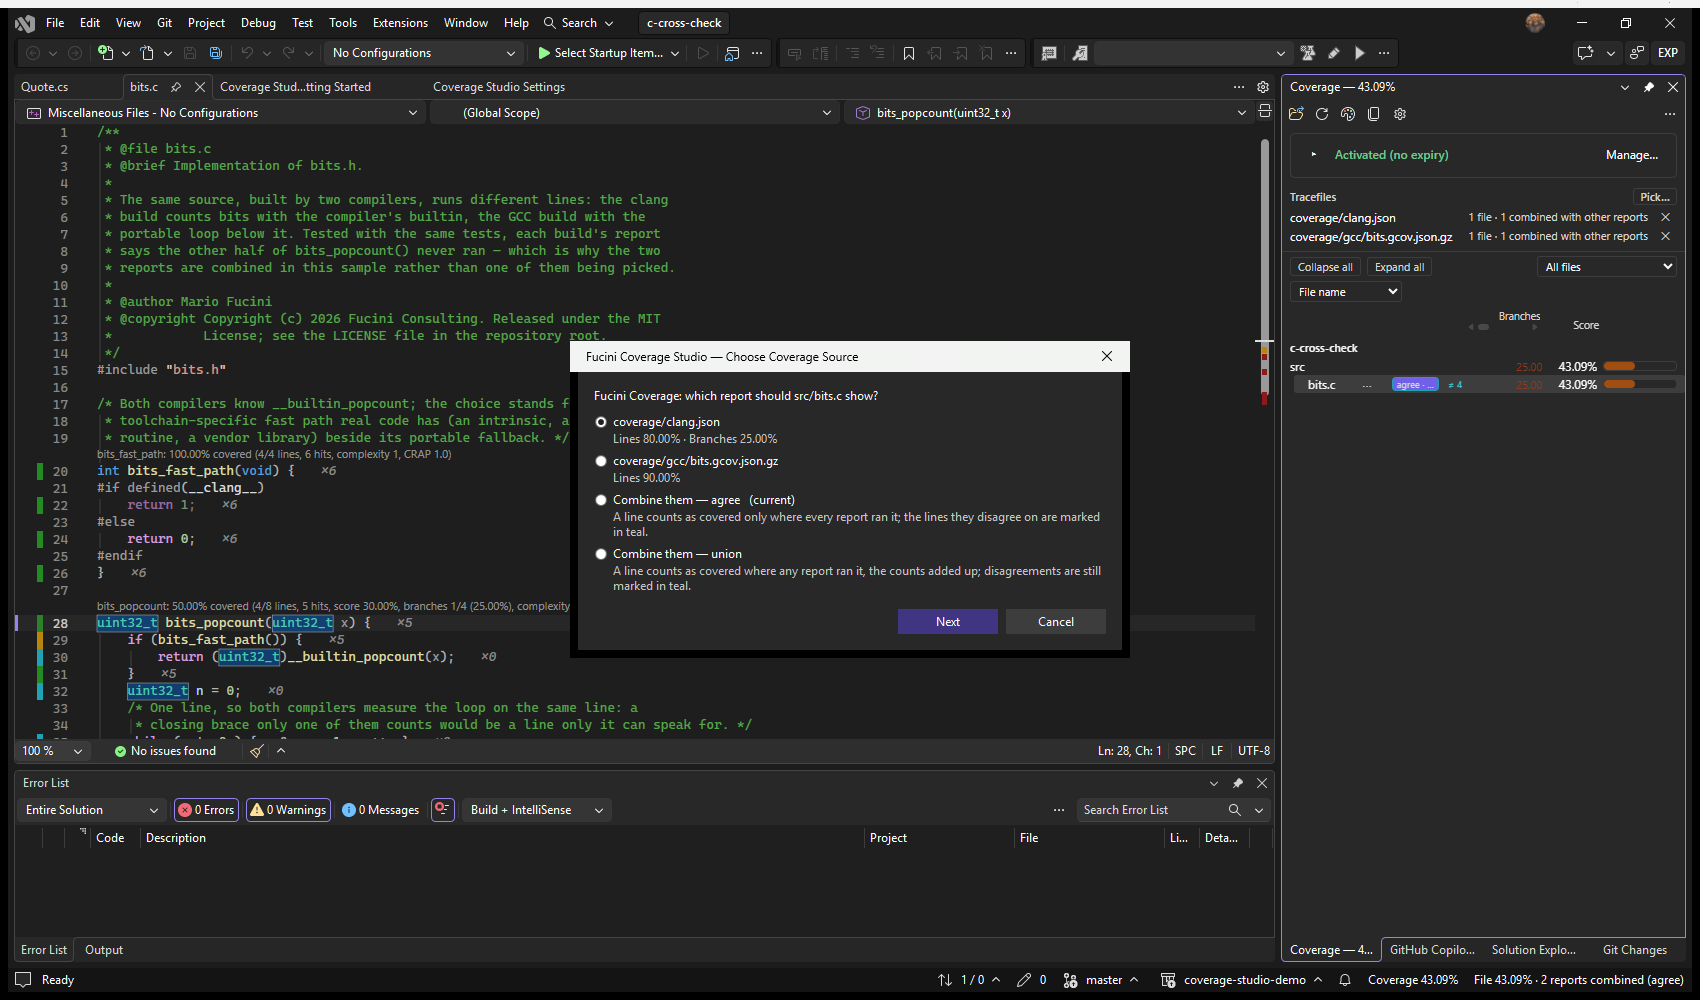
You rarely write the rules by hand. Right-click a file in the Coverage view and choose Choose Coverage Source... (or run Choose Coverage Source for This File... on the open file): it lists every report that measures the file, each with its own lines, branches and MC/DC, then Combine them — agree and Combine them — union; pick one and say whether it holds for the file, its folder or a pattern. Clear Coverage Source for This File... takes the rule out again. In the settings each rule is a glob over the files, a glob over the report (a pattern without / matches the report's file name, {a,b} names several) and, to combine, "combine": "agree" or "union". The first rule whose files match and whose report measures the file decides; a file only one report measures is never taken from it. Branches, MC/DC and regions of a combined file come from the report richest in them. coverageFile.mergeStrategy: "order" settles the files no rule speaks for by the order of coverageFile.paths instead of the times.
{
  "fuciniCoverage.coverageFile.paths": ["clang.json", "gcc/bits.gcov.json.gz"],
  "fuciniCoverage.coverageFile.sources": [
    { "files": "src/**", "report": "{clang.json,bits.gcov.json.gz}", "combine": "agree" }
  ]
}
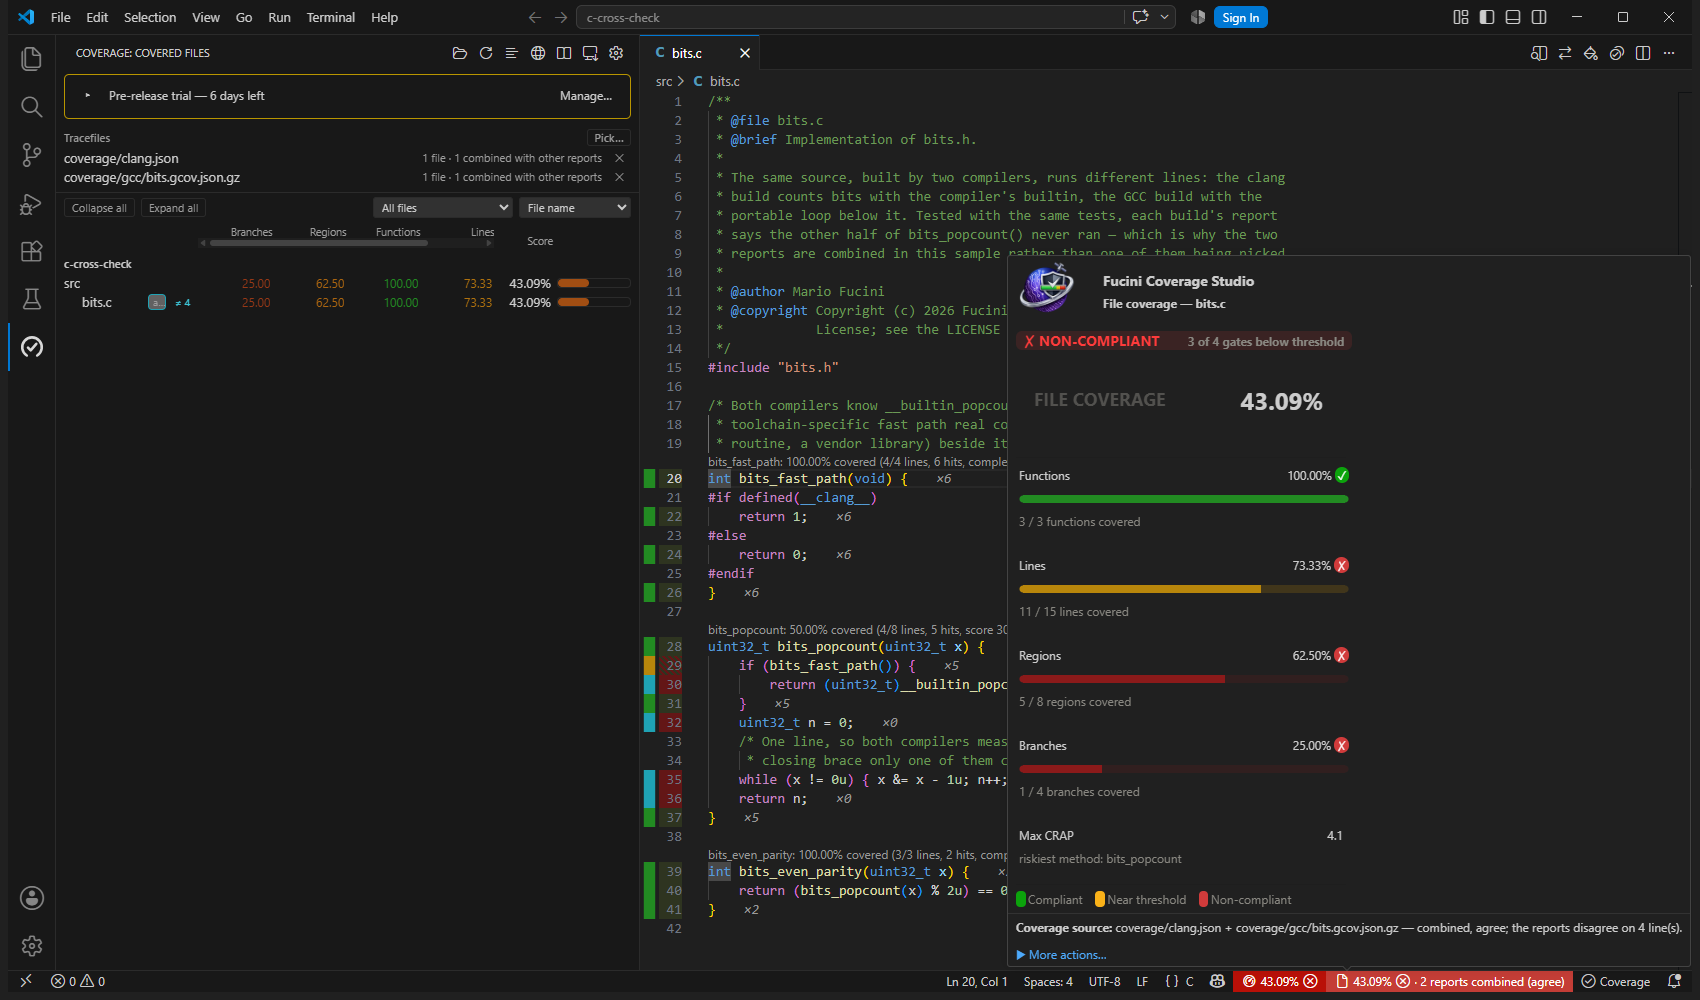
What you see: the file's row in the Coverage view names the report its numbers come from, or, combined, every report and the mode with ≠ n for the lines in dispute. The gutter and the Annotated Source mark those lines in teal and say which report ran them how often. The status bar's hover card names the source of the open file and, for the whole run, the rules in force and how the other files were decided. The demo's samples/c-cross-check is the two-compiler case, ready to open. Visual Studio does all of this too: Choose Coverage Source... on a row of the Coverage window, and Choose and Clear Coverage Source for This File... under Tools > Coverage Studio.
Choosing and combining sources is part of the paid plans. On Community the newest report wins every file, as it does with no rule, and a rule in the settings is said to be unused rather than silently ignored.
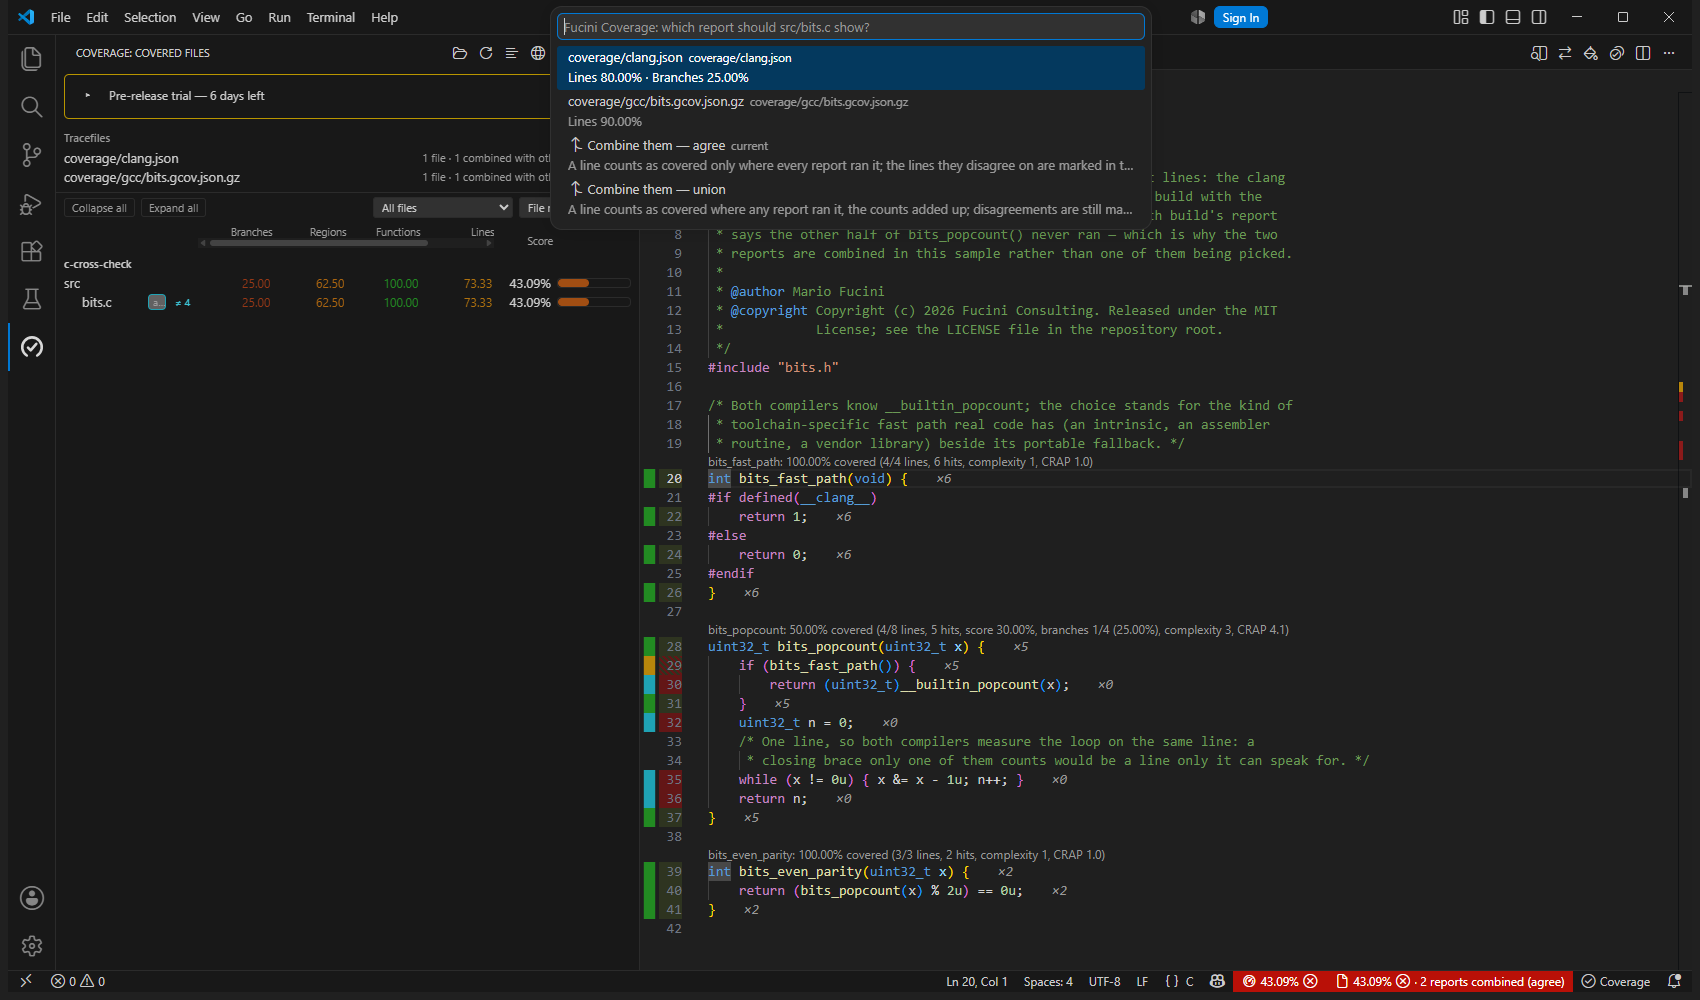
bits.c from the Coverage view — the clang report, the GCC report, or both combined.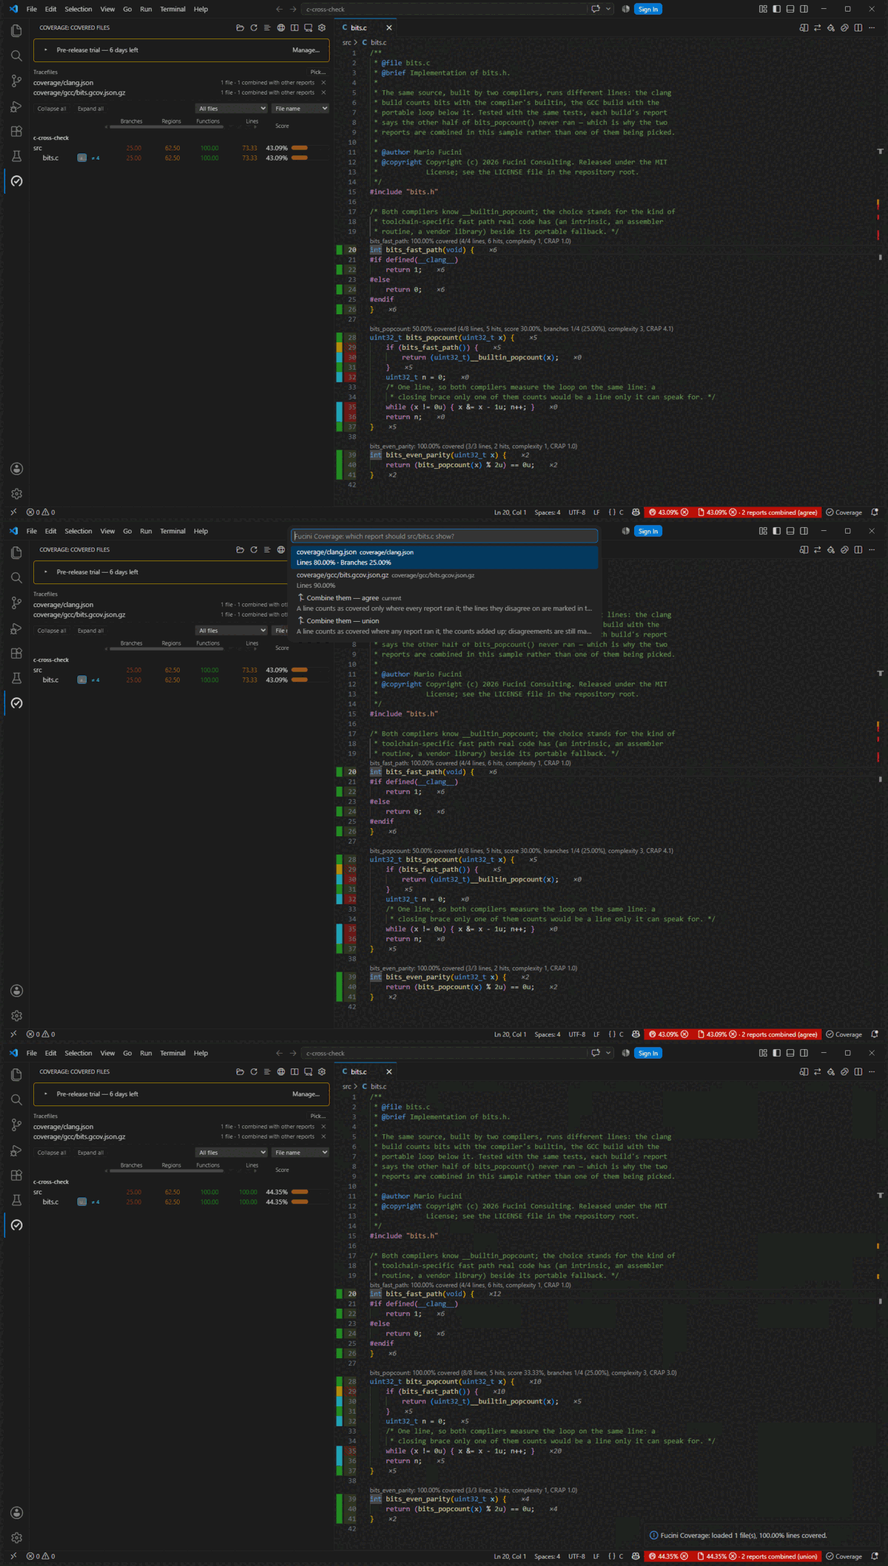
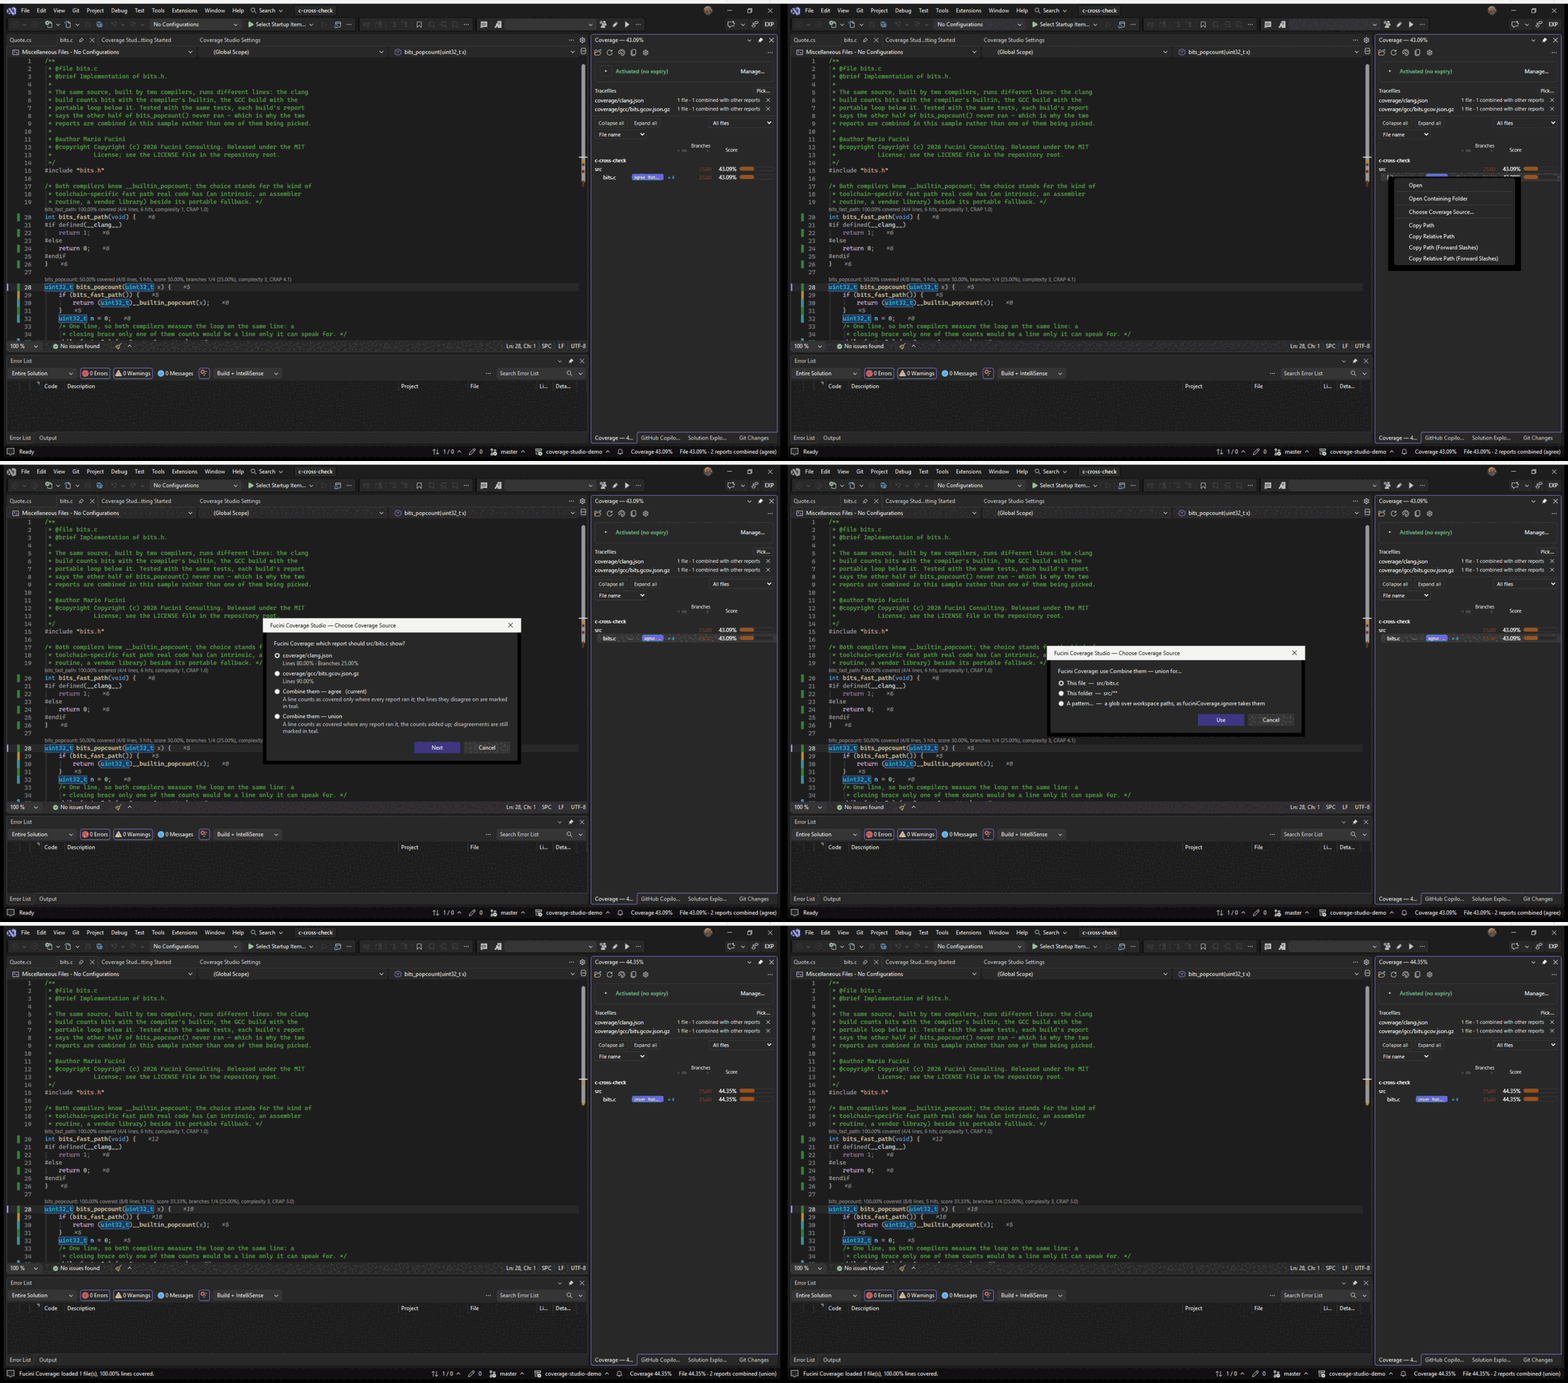
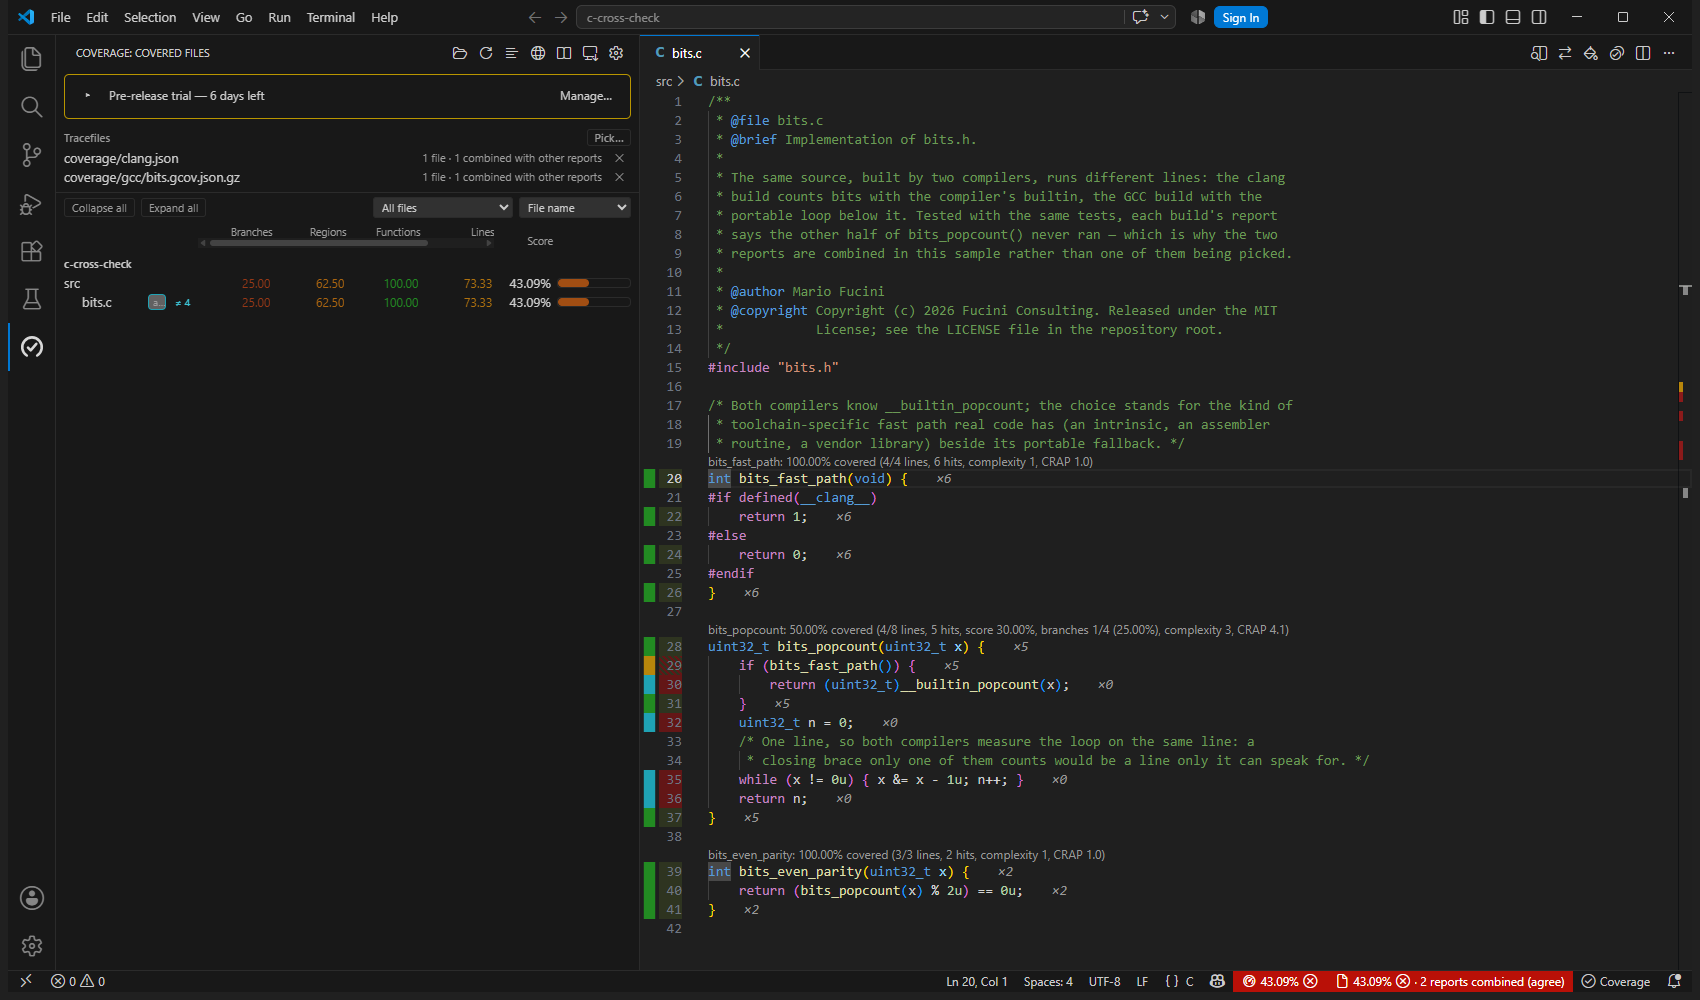
bits.c, clang and GCC combined by agree — the row says ≠ 4, and the four lines only one build ran are teal.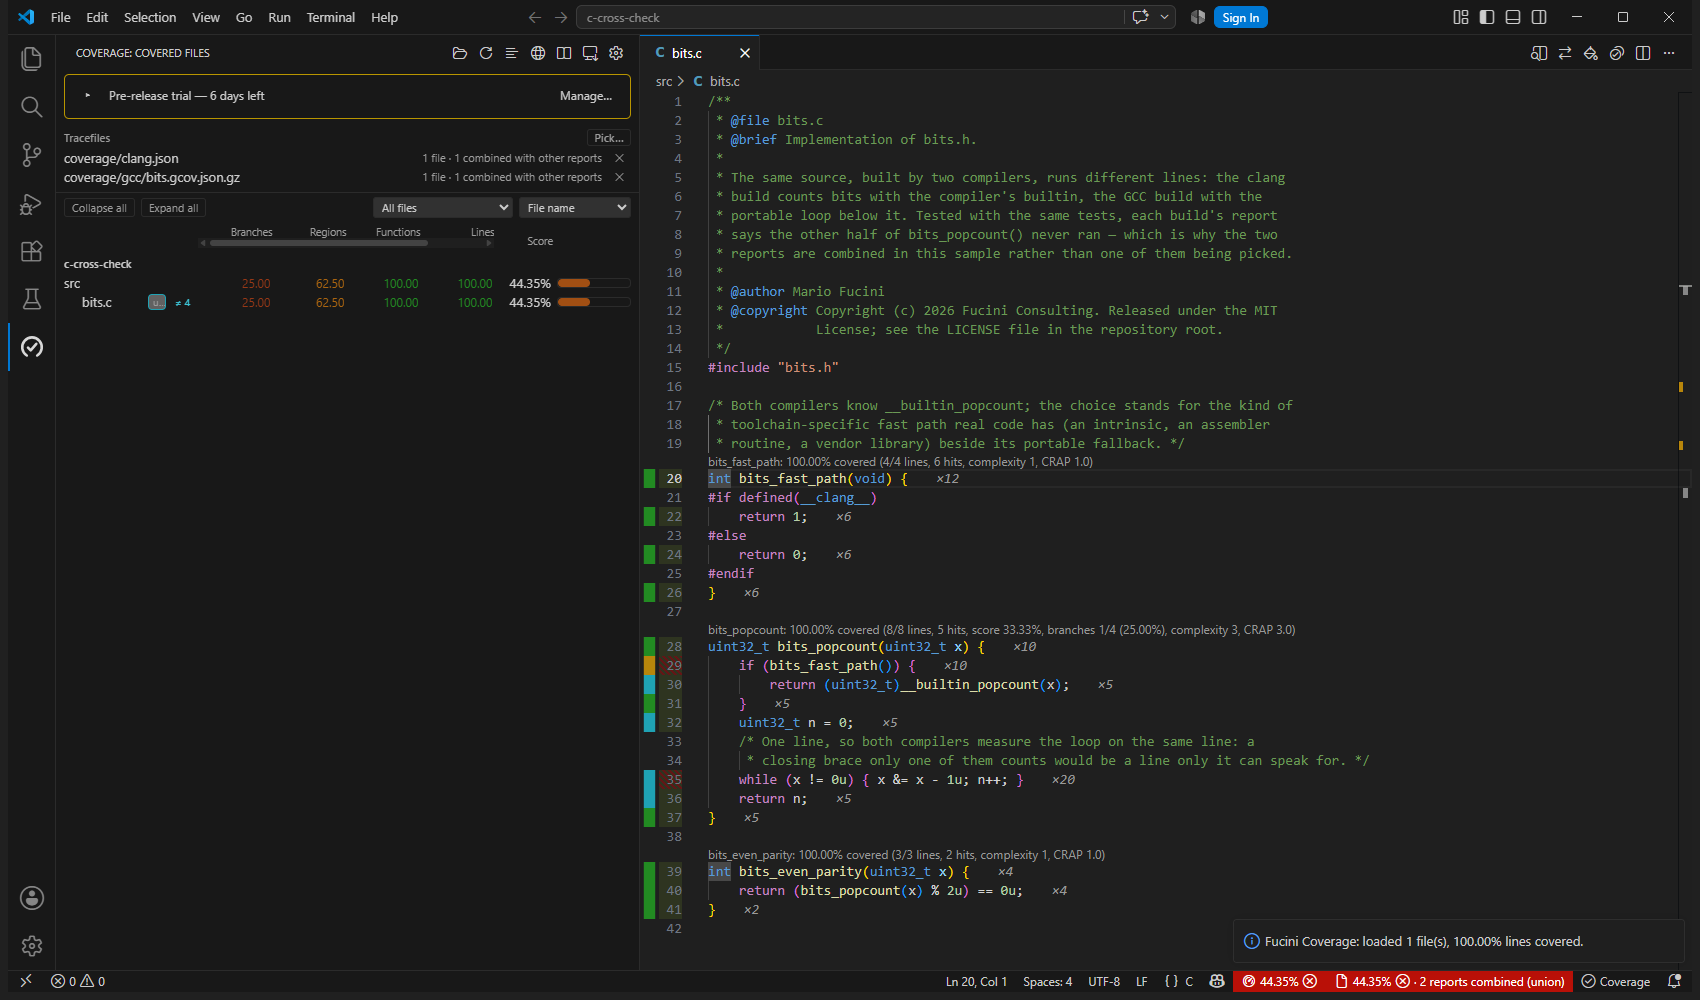
bits.c reaches 100% of its lines — and the lines the builds disagree on stay teal.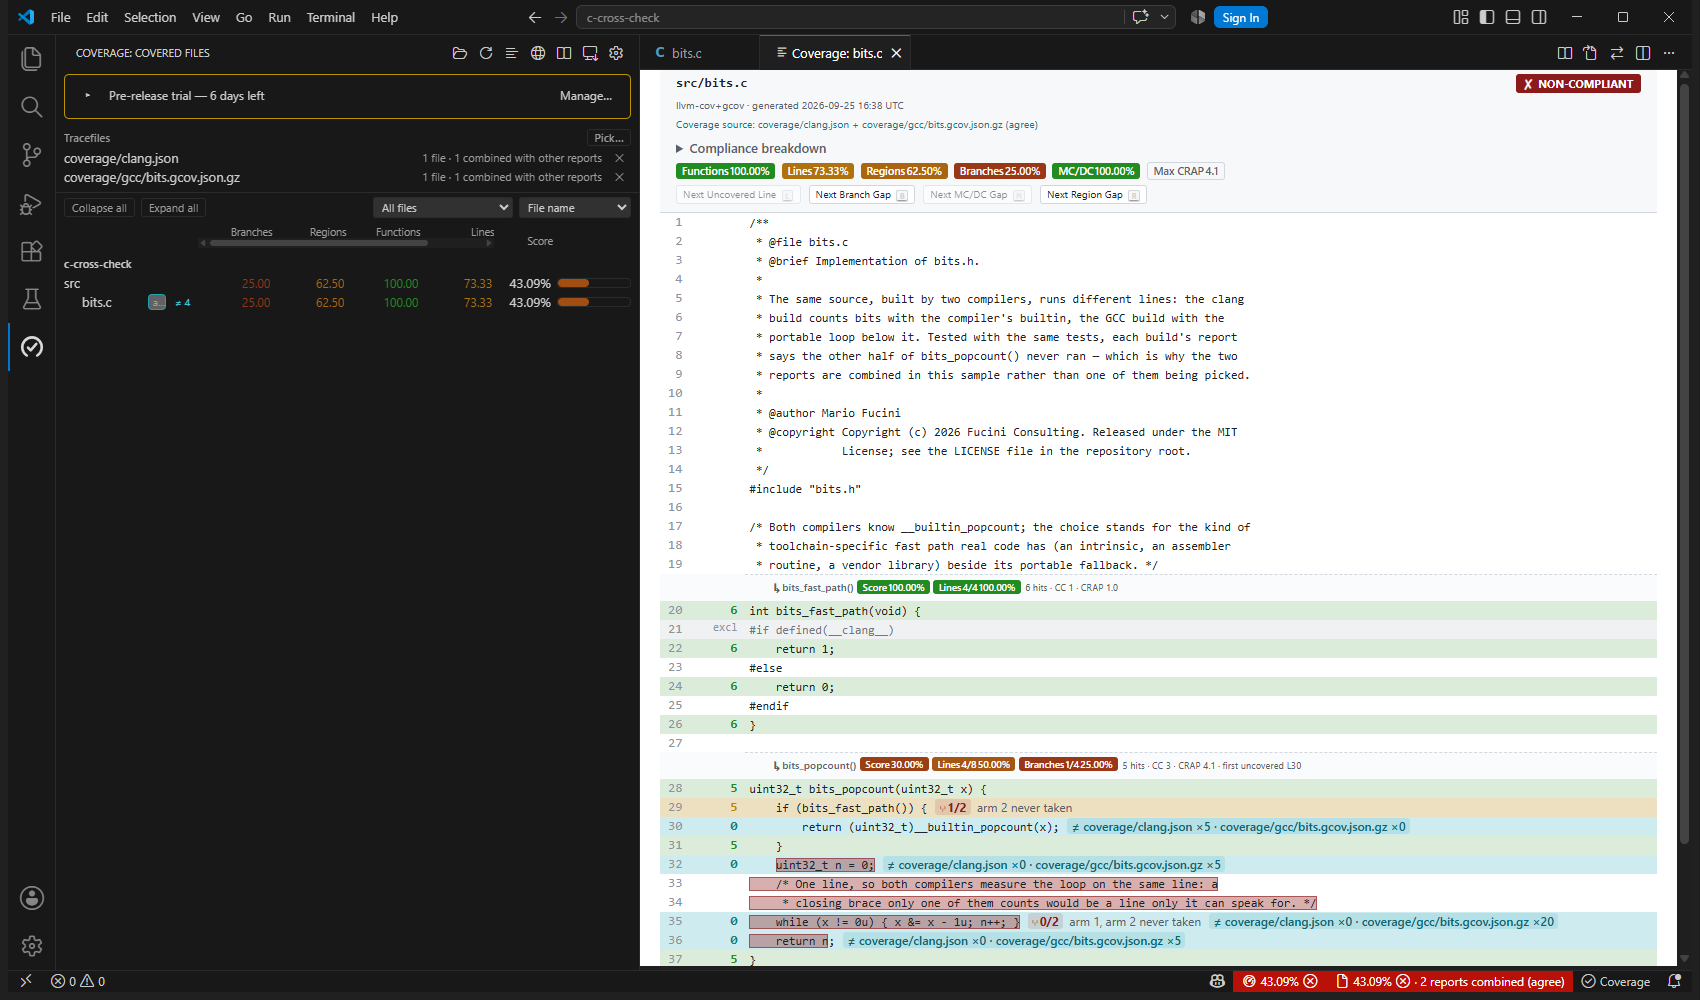
7. Path remapping
CI often records absolute build-machine paths that don't exist on your workstation. Rewrite them with ordered rules:
{
  "fuciniCoverage.pathRemap": [
    { "from": "/builds/ci/project", "to": "${workspaceFolder}" },
    { "from": "\\\\", "to": "/" }
  ]
}
Rules apply in order; the first match wins per prefix. Use this to fold Windows/Unix separator differences or map a container path onto your checkout.
You rarely have to write the rule yourself. The most common “it loaded but nothing lights up” is a tracefile whose paths come from a container or a CI checkout (/build/src/a.c, /home/runner/work/repo/repo/src/a.c, C:\agent\_work\1\s\src\a.c) while the workspace has src/a.c. When a load leaves files unmatched, the extension looks the file names up in the workspace, infers the prefix rule that explains the most of them, logs it as [FUCINI_REMAP_002], and the load result offers Apply Suggested Remap — one click appends the rule to fuciniCoverage.pathRemap and reloads. Suggest Path Remap Rule runs the same analysis on demand from the palette. Nothing is written without the click.
A to may use ${workspaceRoot}, which stands for the workspace folder the tracefile lives in; in a multi-root workspace it tries that folder first, then every other folder that turns out to have the file. The rules themselves are read per folder, so each root of a multi-root workspace can carry its own.
8. In-editor coverage
- Gutters & ruler — by default the editor's own gutter shows only findings: MC/DC bars, since-last-run triangles, edited-line dots.
editorGutter.modeadds uncovered-only bars or a hit-count heatmap (below); the colour-coded view of a whole file is the Annotated Source. - Function CodeLens — coverage % above each function; click to jump to its first uncovered line. Toggle with
codeLens.enabled. - Branch & MC/DC hover — hover a decision line for per-arm taken/not-taken counts and a per-condition vector table. Enable a coloured margin bar with
mcdcGutter.enabled. - Dead-code warnings — functions with measurable lines and zero coverage are flagged in the Problems panel (
deadCode.enabled). - Next / Previous Uncovered — jump between gaps.
- Status bar — a run-wide
$(dashboard) NN%item and a per-file item, both colour-coded by the composite score; hover for a full metrics table. - Explorer badges — per-file and per-folder coverage badges, with the metric breakdown on hover. Off by default: turn them on with
explorerBadges.enabled. - Since last run — a red triangle on every line executed in the previous run and not in this one, a green one for the reverse, with the overview ruler and the hit counts on hover.
- Edited buffers — every mark, hover and CodeLens moves with the text as you edit, and withdraws from a rewritten line, where a grey dot says why.
- Inline hit counts —
hitCounts.inlinewrites×12after each line a statement starts on,×0included: the number that has always been on hover, without hovering. Toggle Inline Hit Counts flips it; the status-bar menu offers it as Show or Hide, whichever applies. - Per-line Problems entries —
problems.perLineputs an Information diagnostic, with a squiggle in the editor, on every contiguous block of lines that never ran in an open document (a forty-line dead function is one entry, not forty) and, asuncoveredAndPartial, on every line whose branch arm was never taken. The entries follow their lines as you edit and go when the document closes; the per-file entry behindproblems.enabledis unchanged. - Line tint —
lineHighlightputs a translucent wash behind the lines themselves for what the gutter marks (uncovered, orheatmapfor the executed lines as well). Its own setting, so the gutter can stay clean while the gaps are tinted, or the other way round. - Overview ruler —
overviewRulerdecides the scrollbar stripe independently of the gutter:follow(with the bars, as before),uncovered(always, so the gutter can be off and the scrollbar still maps the file's gaps) oroff. - Which tracefile covered a line — with several reports merged, the hit-count hover ends with Covered by: and each report that covered that line, lcov's
TN:suite name included; clicking a tracefile row in the Coverage view lights the lines it contributed in every open editor.
 Screenshot pending — add assets/img/codelens-hover.png (see SCREENSHOTS.md).
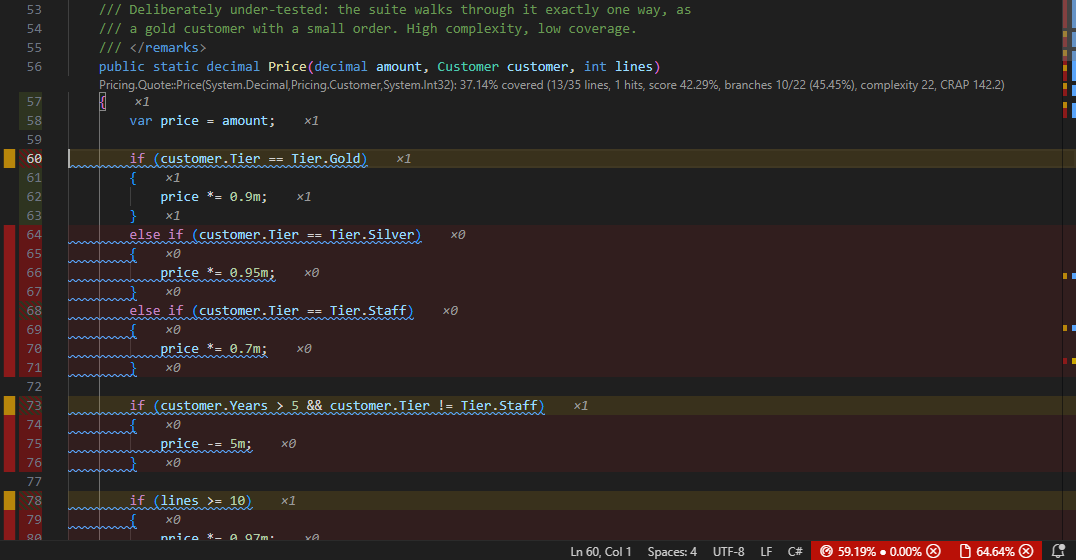 Screenshot pending — add assets/img/codelens-crap.png (see SCREENSHOTS.md).
 Screenshot pending — add assets/img/jump-between-gaps.gif (see SCREENSHOTS.md).
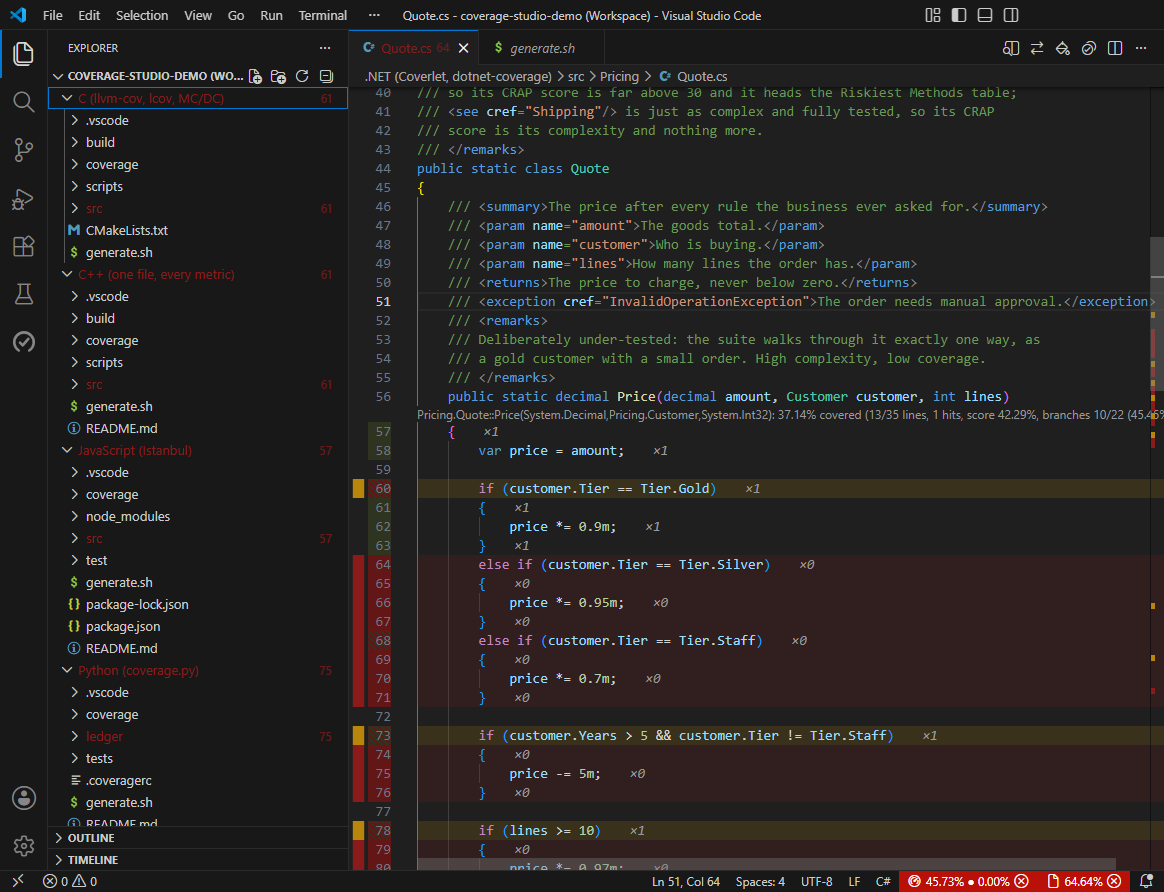 Screenshot pending — add assets/img/explorer-badges.png (see SCREENSHOTS.md).
Editor gutter modes
editorGutter.mode decides what the editor's own gutter shows about coverage, on top of the findings it always shows. off (the default) is only those. uncovered puts a bar on every line that never ran and an amber one on every line with a branch arm never taken, and nothing on covered lines, so a green wall does not hide the three red ones. coverage adds a green bar on every covered line, so the whole file reads red, amber and green in the colour scale's colours. heatmap adds a warm shade on every executed line instead, hotter the more often it ran — it shows how often a line ran, not whether it is covered, so a file at 100% is yellow to brown there, never green. Choose Editor Gutter Mode... picks one from the palette or the status-bar menu; the mode button at the right of the status bar, or Alt+G, moves on to the next with one press (statusBar.showModeToggle hides the button). Both write the setting. The example turns on the uncovered bars and the inline counts together:
{
  "fuciniCoverage.editorGutter.mode": "uncovered",
  "fuciniCoverage.hitCounts.inline": true
}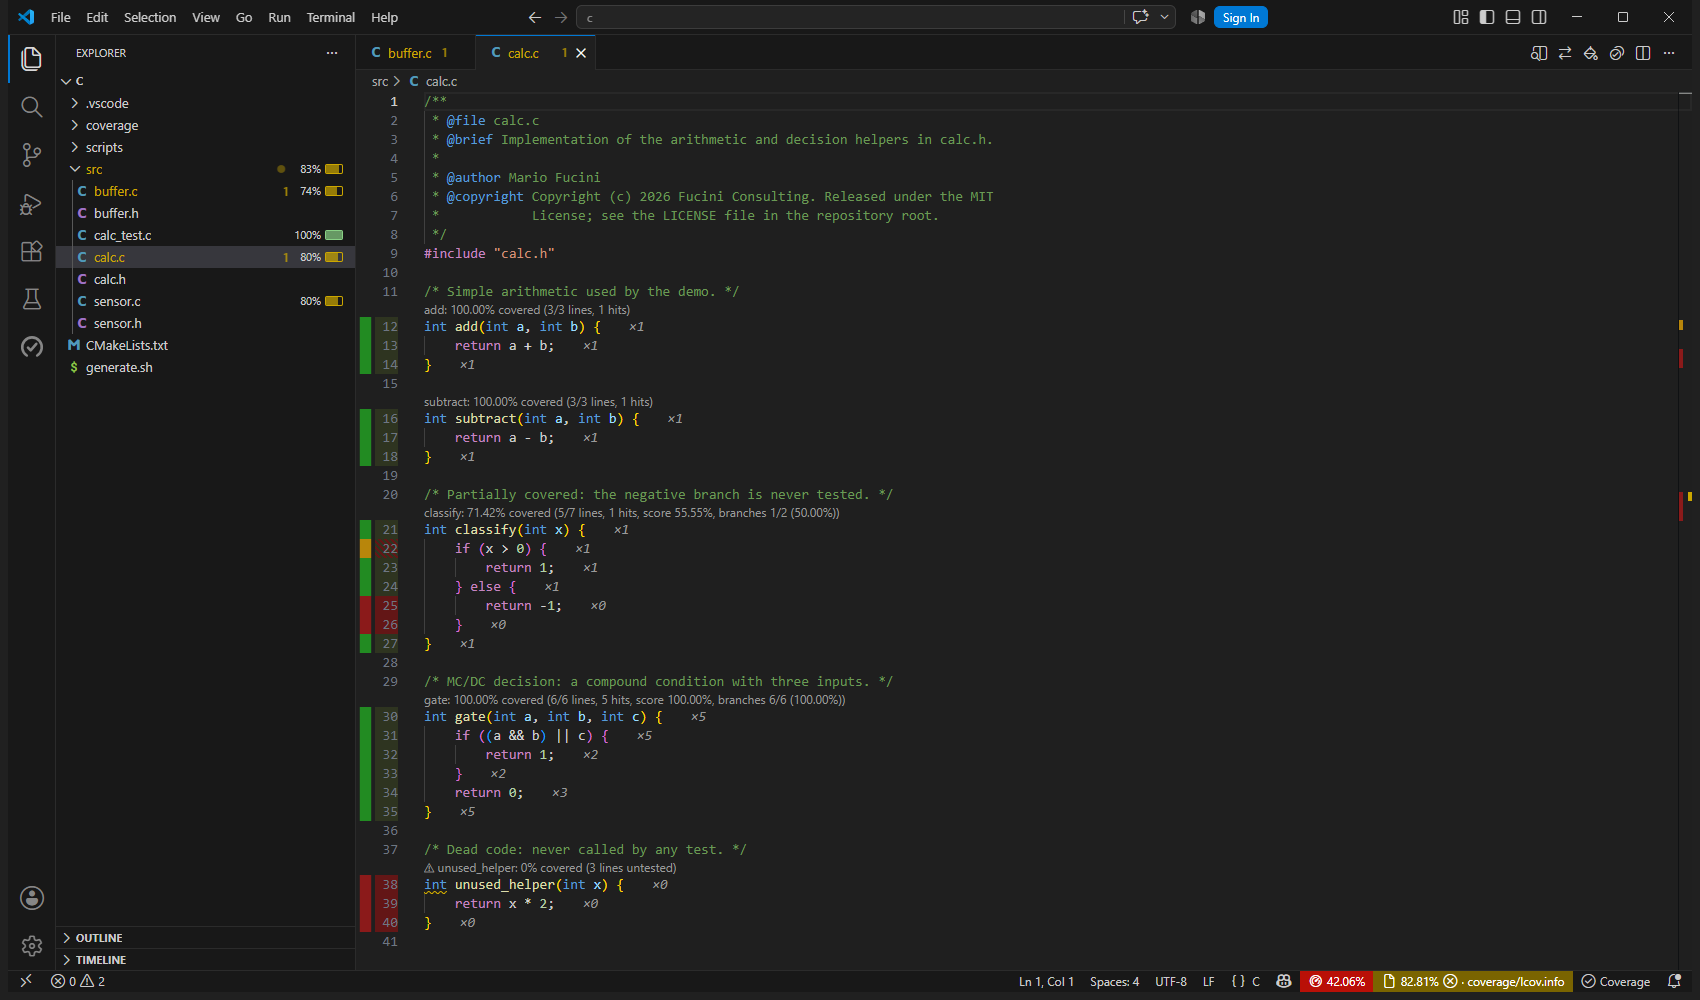
coverage mode — green where a line ran in full, amber where a branch arm never did, red where nothing ran. The file’s status-bar item names the report its numbers come from; the mode button beside it says Coverage.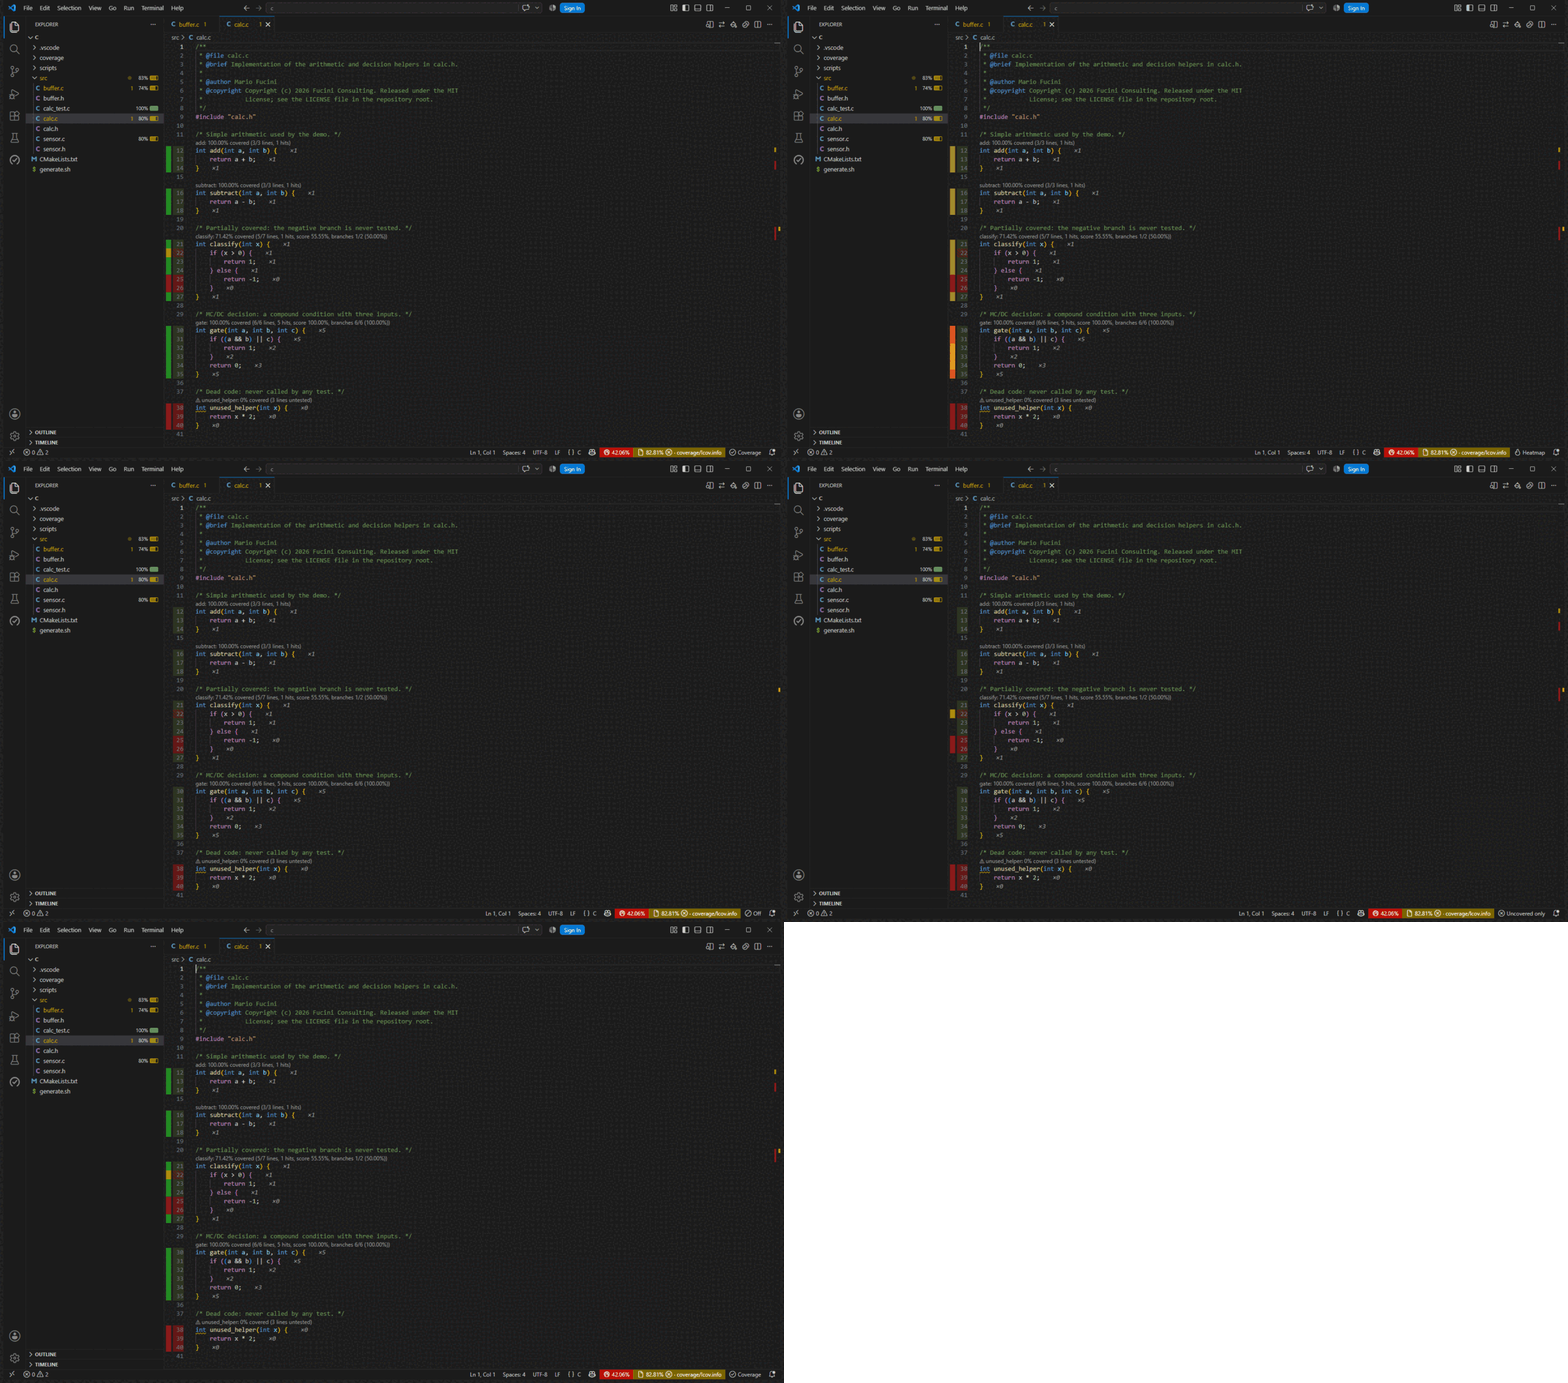
Alt+G four times — heatmap, off, uncovered, and back to coverage.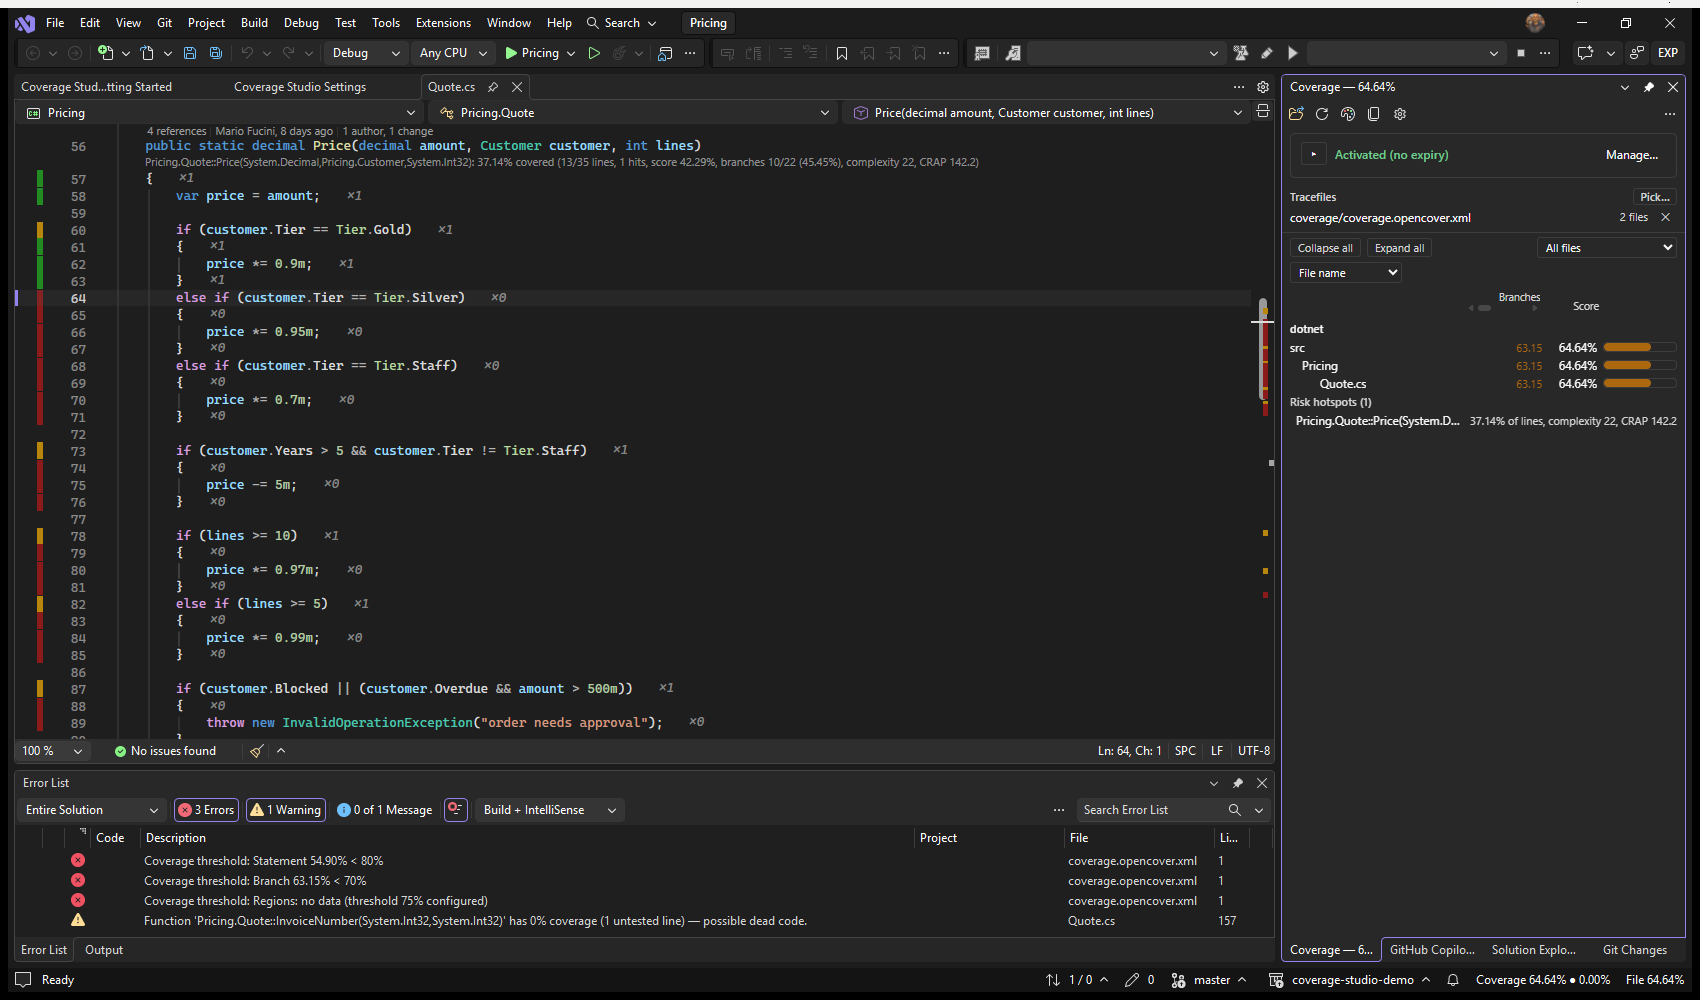
Quote.cs.The heatmap is relative to the file. The shade of a line compares its count with the hottest line of the same file, on a logarithmic scale, in five steps — so a loop body that ran a thousand times and a function that ran twice are both visible, rather than one drowning the other, and a file where everything ran exactly once is uniformly warm rather than uniformly pale. On a dark theme the ramp runs from dim olive to vivid orange, on a light theme from pale yellow to brown: either way more colour means more executions, and red stays reserved for lines that never ran. lineHighlight: "heatmap" puts the same shades behind the code as a wash, and hitCounts.inline writes the exact count after the line.
{
"fuciniCoverage.editorGutter.mode": "heatmap",
"fuciniCoverage.lineHighlight": "heatmap",
"fuciniCoverage.hitCounts.inline": true
}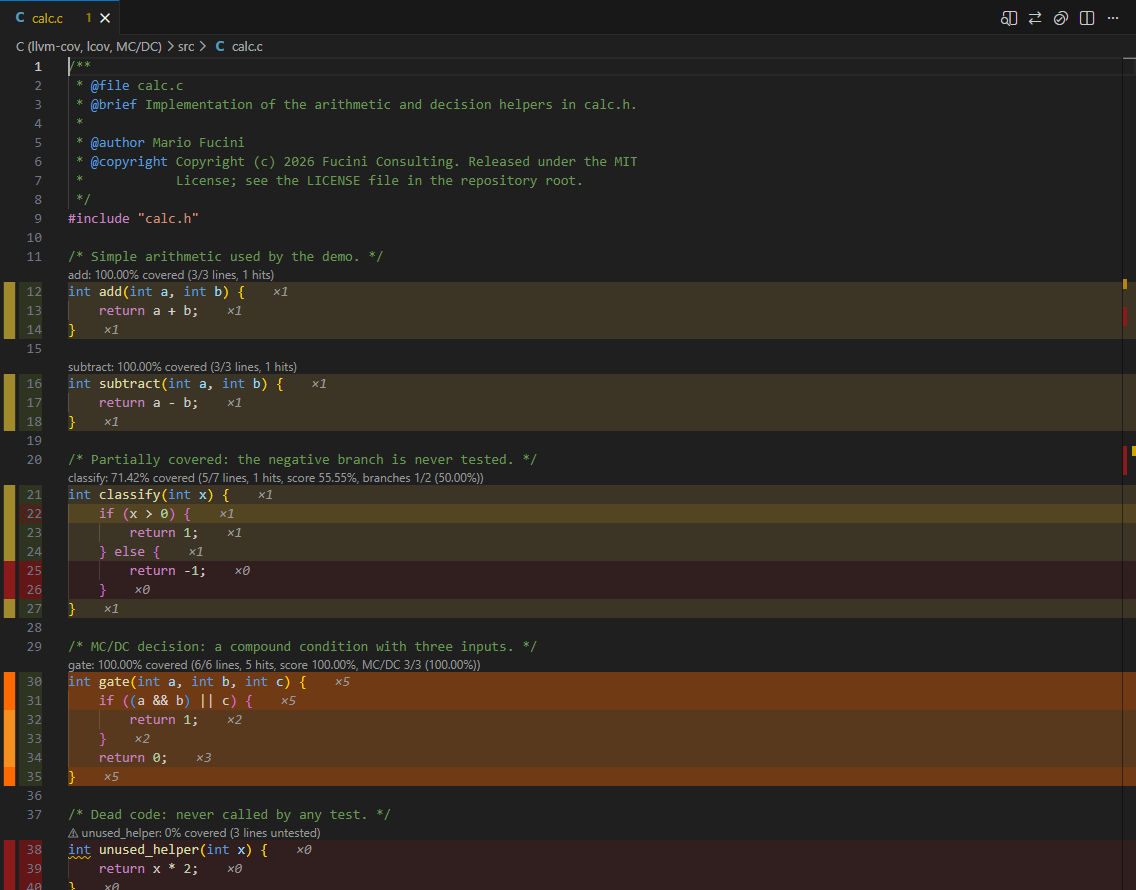 Screenshot pending — add assets/img/heatmap-dark.png (see SCREENSHOTS.md).
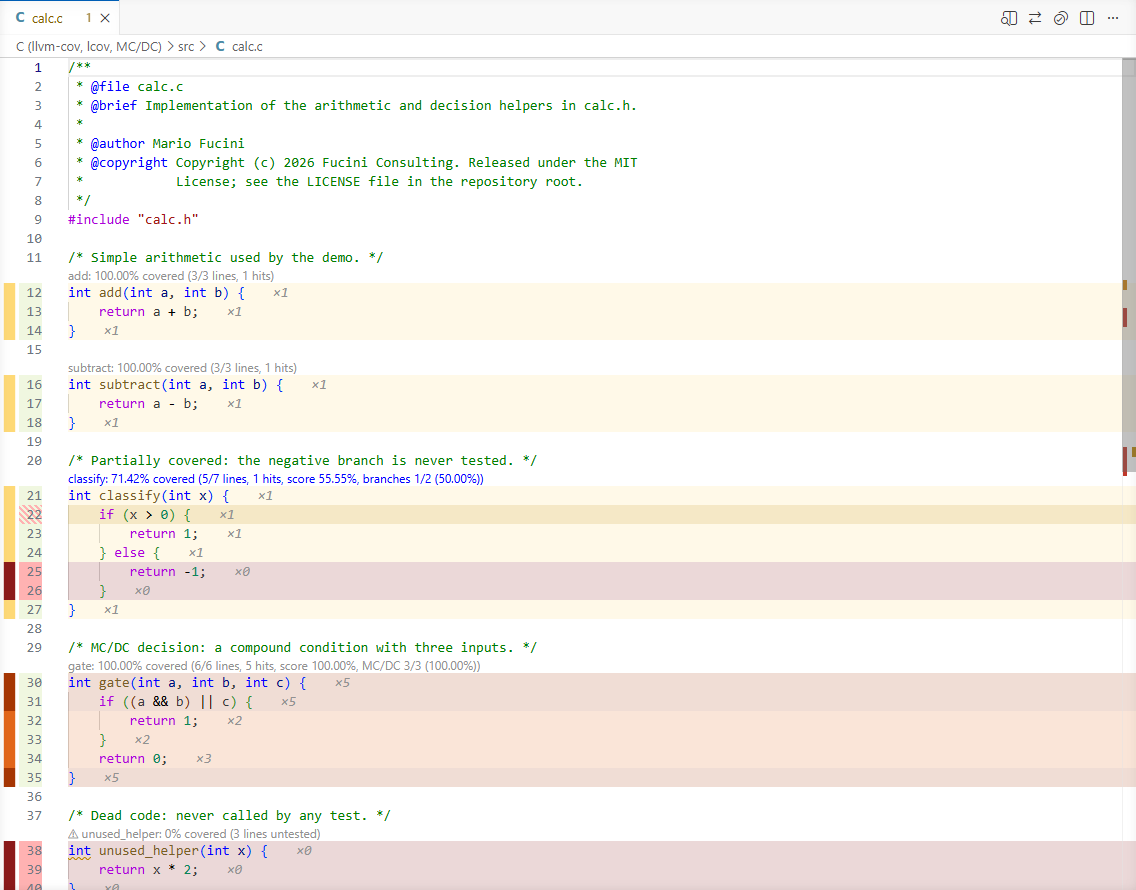 Screenshot pending — add assets/img/heatmap-light.png (see SCREENSHOTS.md).
 Screenshot pending — add assets/img/heatmap.gif (see SCREENSHOTS.md).
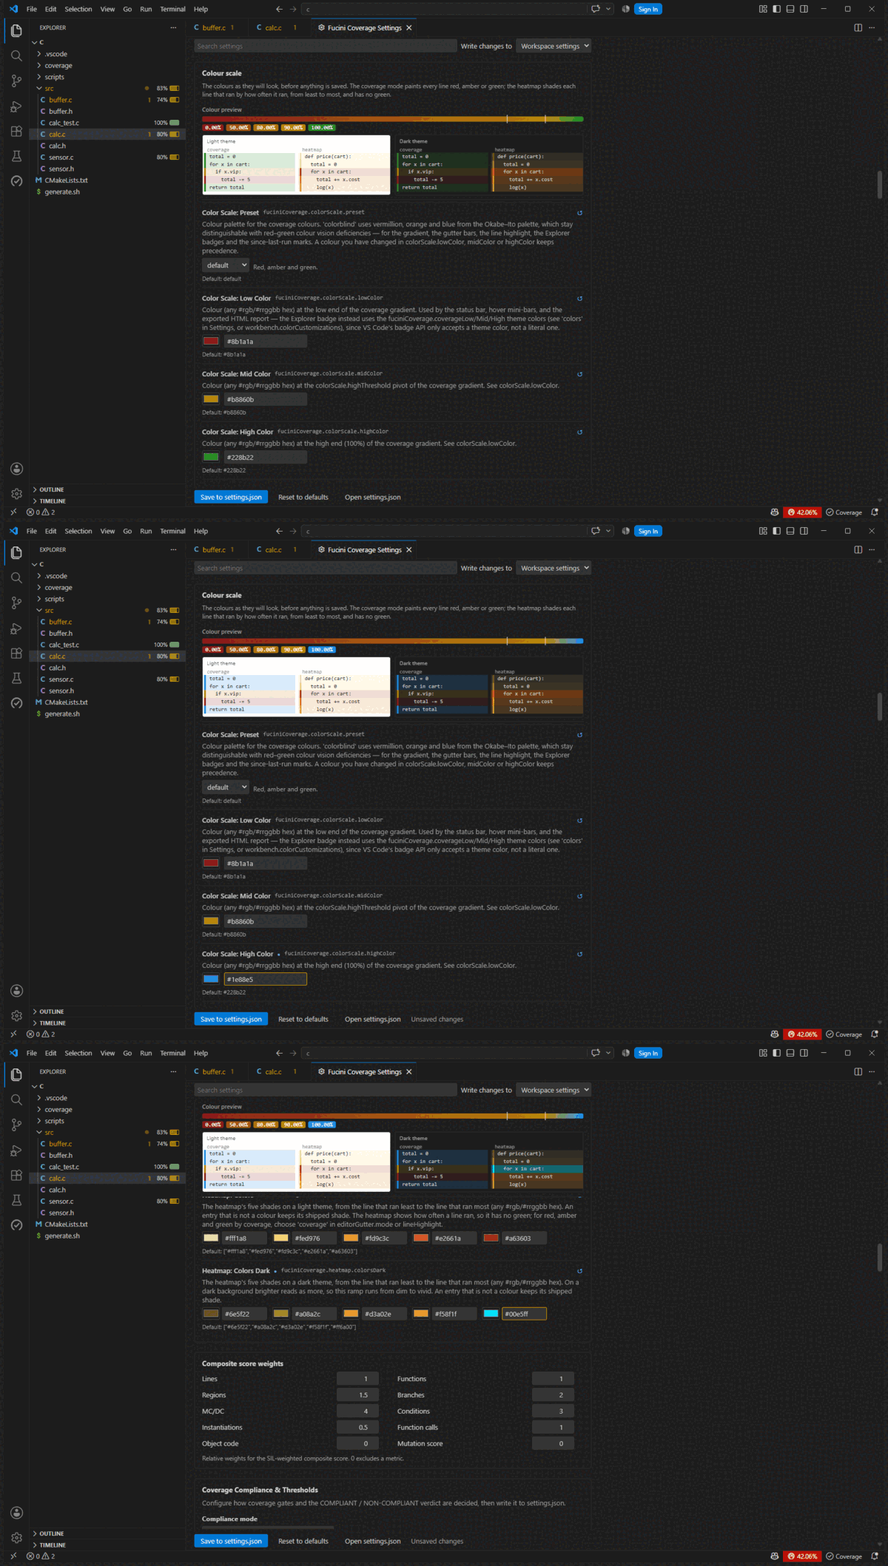
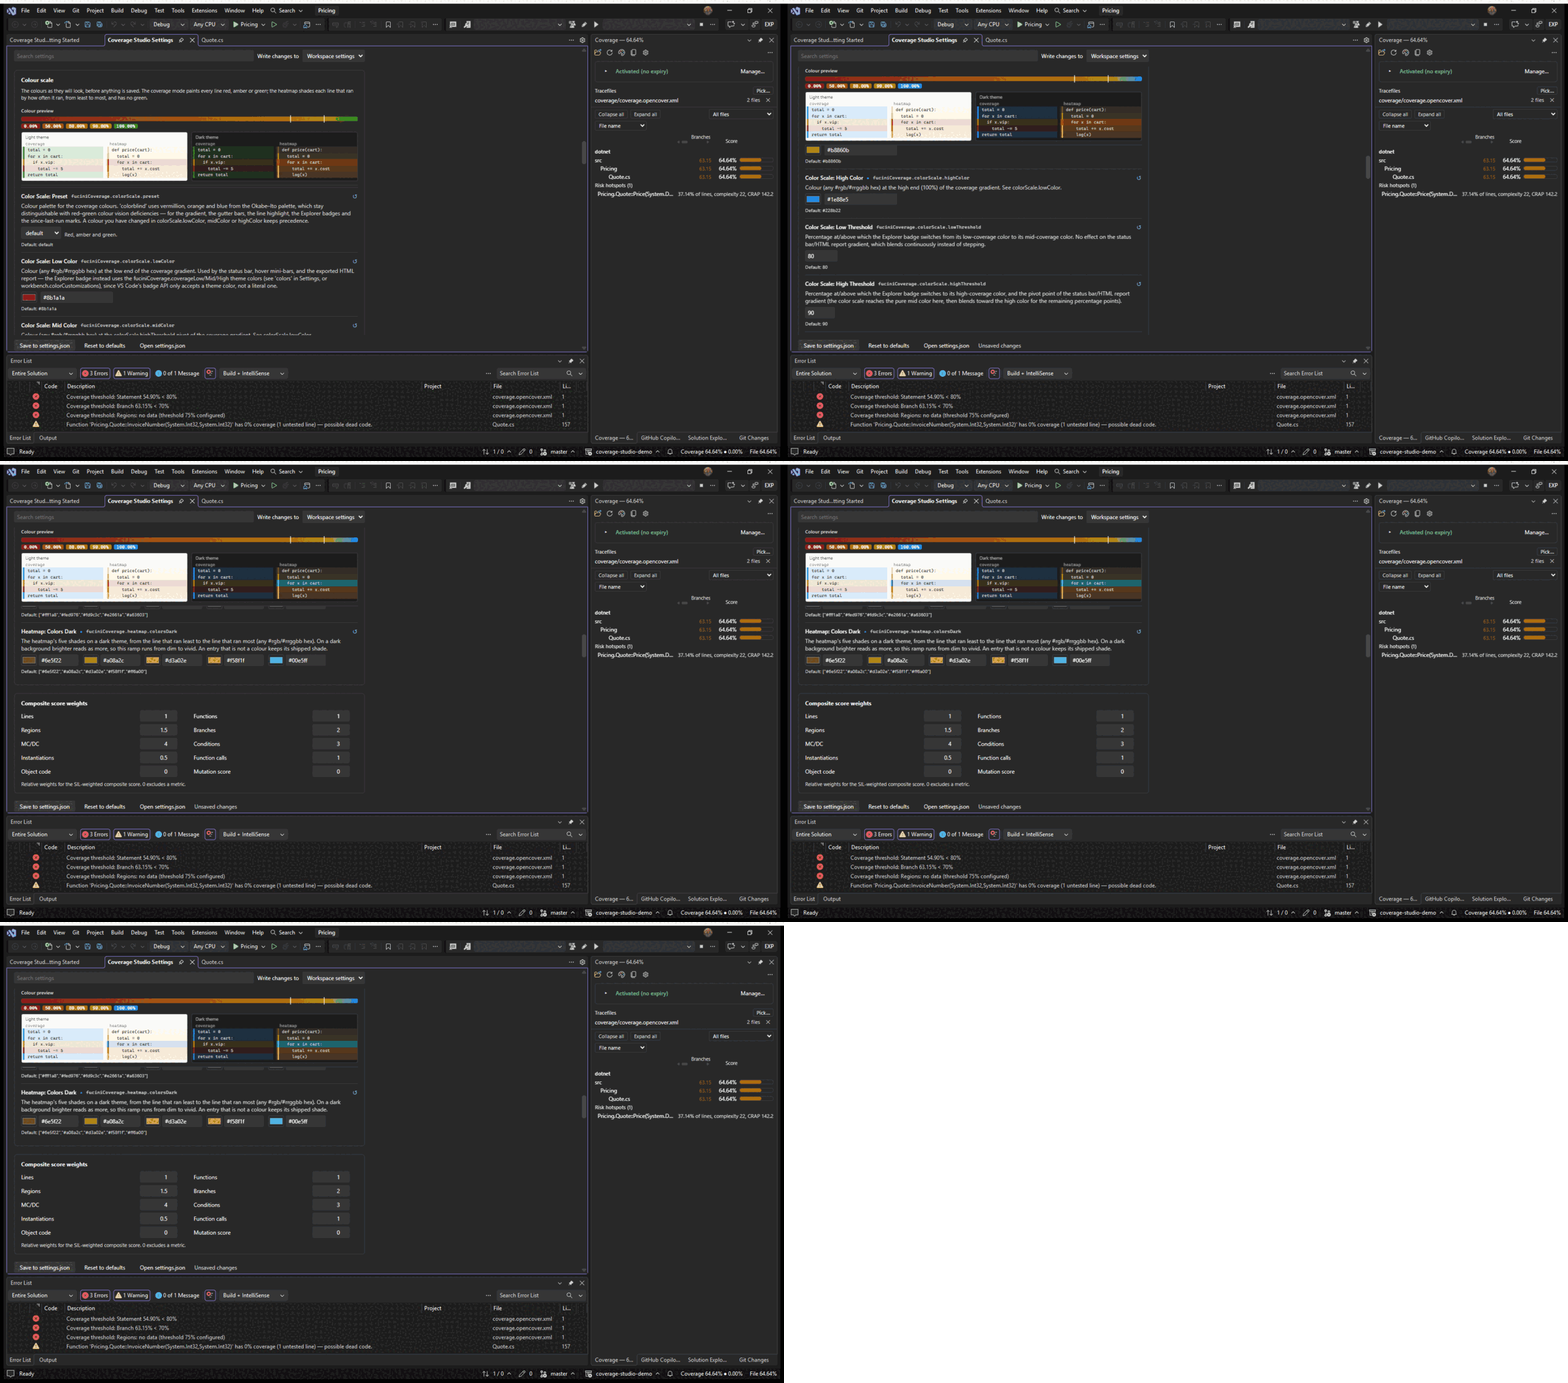
The colours are yours. colorScale.lowColor, midColor and highColor paint the red, amber and green of the gutter, the washes and every percentage; heatmap.colors and heatmap.colorsDark hold the heatmap's five shades for a light and a dark theme, from the line that ran least to the one that ran most. The settings page shows the result before anything is saved: under Colour scale, a preview stays in view while the rows scroll past — the gradient with its two pivots, a few percentages in their colours, and a small light and a small dark editor painted in the coverage mode and in the heatmap — and it repaints as a colour is picked.
{
  "fuciniCoverage.heatmap.colors": ["#e3f2fd", "#90caf9", "#42a5f5", "#1e88e5", "#0d47a1"]
}
The part of a line that never ran
A line is covered or it is not, and the truth is often in between: return x > hi ? hi : x; ran, its hi arm never did. With lineHighlight on, the never-executed part of an executed line is tinted in the editor, for every format that carries column ranges (llvm-cov, Istanbul, Go, dotnet-coverage) — the same spans the annotated source marks. Only on lines that ran: a line that never ran is already marked as a whole. A C++ template counts as executed where any instantiation executed it; what each instantiation did is what the instantiation metric reports.
 Screenshot pending — add assets/img/partial-line.png (see SCREENSHOTS.md).
Which tests ran this line
Some reports say not only that a line ran but which tests ran it: coverage.py written with coverage json --show-contexts and dynamic_context = test_function in .coveragerc, OpenCover collected with -coverbytest, and an lcov tracefile written one section per test (TN:), whose sections are added up into one record with a test per line. Hover the start of a line, where the hit count is, and the tests are named — shortened to class and method, the first five by name and the rest as a count; the function's CodeLens says how many tests ran it. Show Tests That Ran This Line — the Command Palette, the editor's context menu, in Visual Studio Tools → Coverage Studio or Ctrl+Shift+U, T — lists them, busiest first, and opens the one you pick where it is written in the workspace. A dotnet test run cannot say which test ran what; set testRun.perTest and Run Tests with Coverage lists the test classes and runs them one at a time, each report tagged with its class, so the hover, the lens and the command can answer for .NET too. It is kept per file, so it survives a merge with a report that knows nothing about tests.
{
  "fuciniCoverage.testRun.perTest": true
}
# .coveragerc
[run]
dynamic_context = test_function
coverage run -m pytest && coverage json --show-contexts Screenshot pending — add assets/img/tests-per-line.gif (see SCREENSHOTS.md).
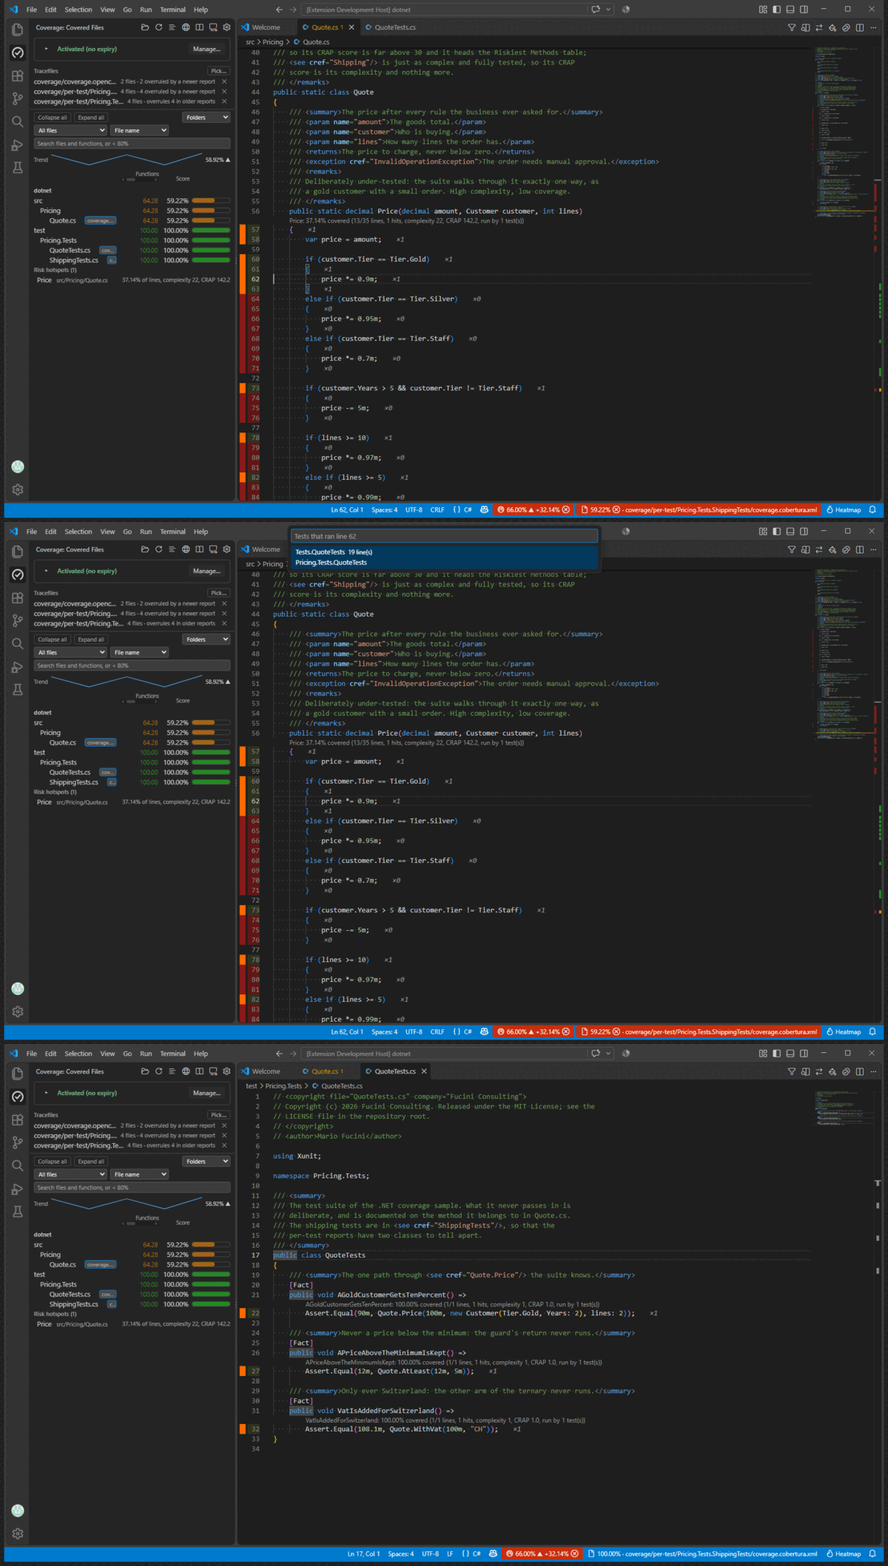 Screenshot pending — add assets/img/tests-for-line.gif (see SCREENSHOTS.md).
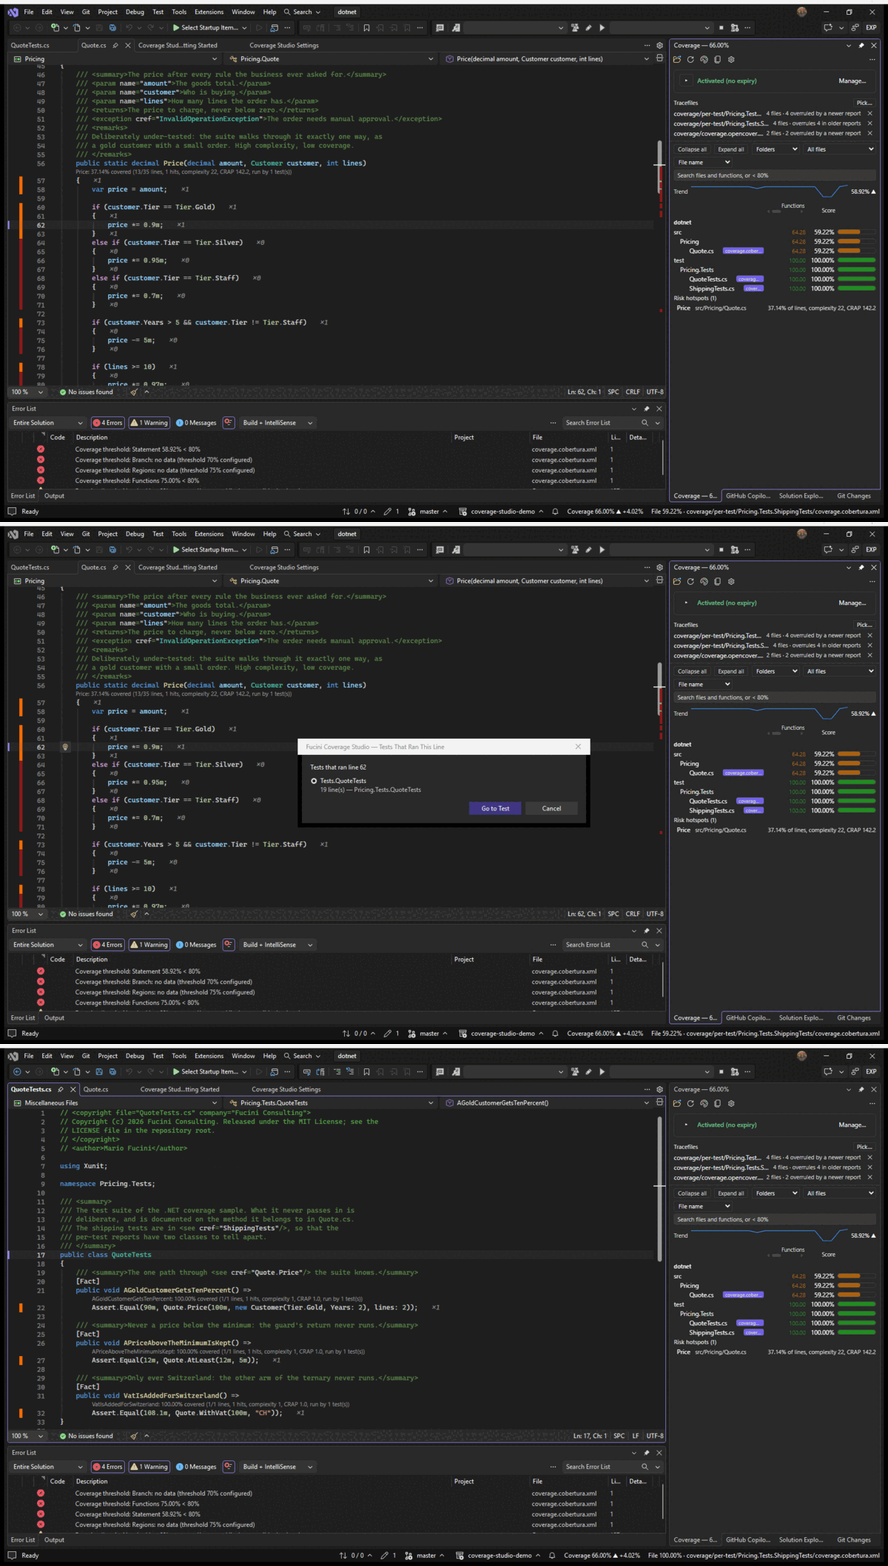
Quote.cs — the test that ran it, and Go to Test opening it.Pass or fail on the marks
A covered line looks the same whether its test passed or not. Where the report says which tests ran a line and the runner's results file says how they ended, a line that a failing test ran gets a red bar at its start and a stripe in the overview ruler; its hover names the failing tests, and Show Tests That Ran This Line writes failed beside each. The place to look when a test is red is the code it went through. The results are read at every load from the folder of each report — any .trx, and the names the JUnit writers use (TEST-*.xml, junit*.xml, test-results*.xml) — and from testResults.paths, as paths or globs relative to the folder. Run Tests with Coverage asks dotnet test for a test-results.trx beside the report, so with testRun.perTest on nothing has to be set up. testResults.enabled turns the reading off.
{
"fuciniCoverage.testResults.paths": ["build/test-results/**/*.xml", "reports/junit.xml"]
}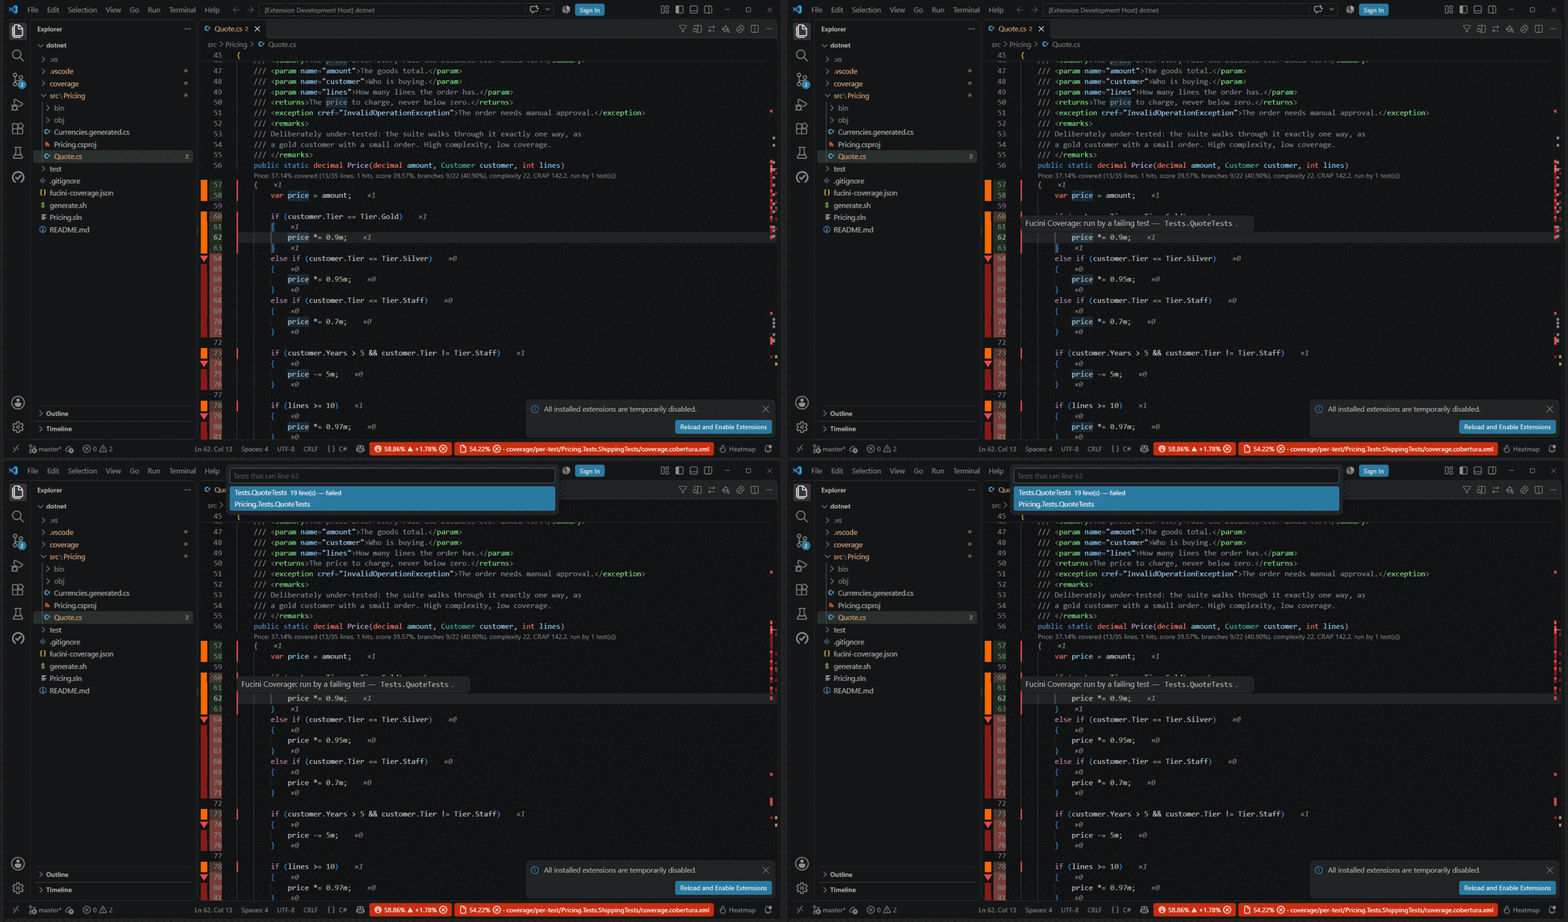 Screenshot pending — add assets/img/pass-fail.gif (see SCREENSHOTS.md).
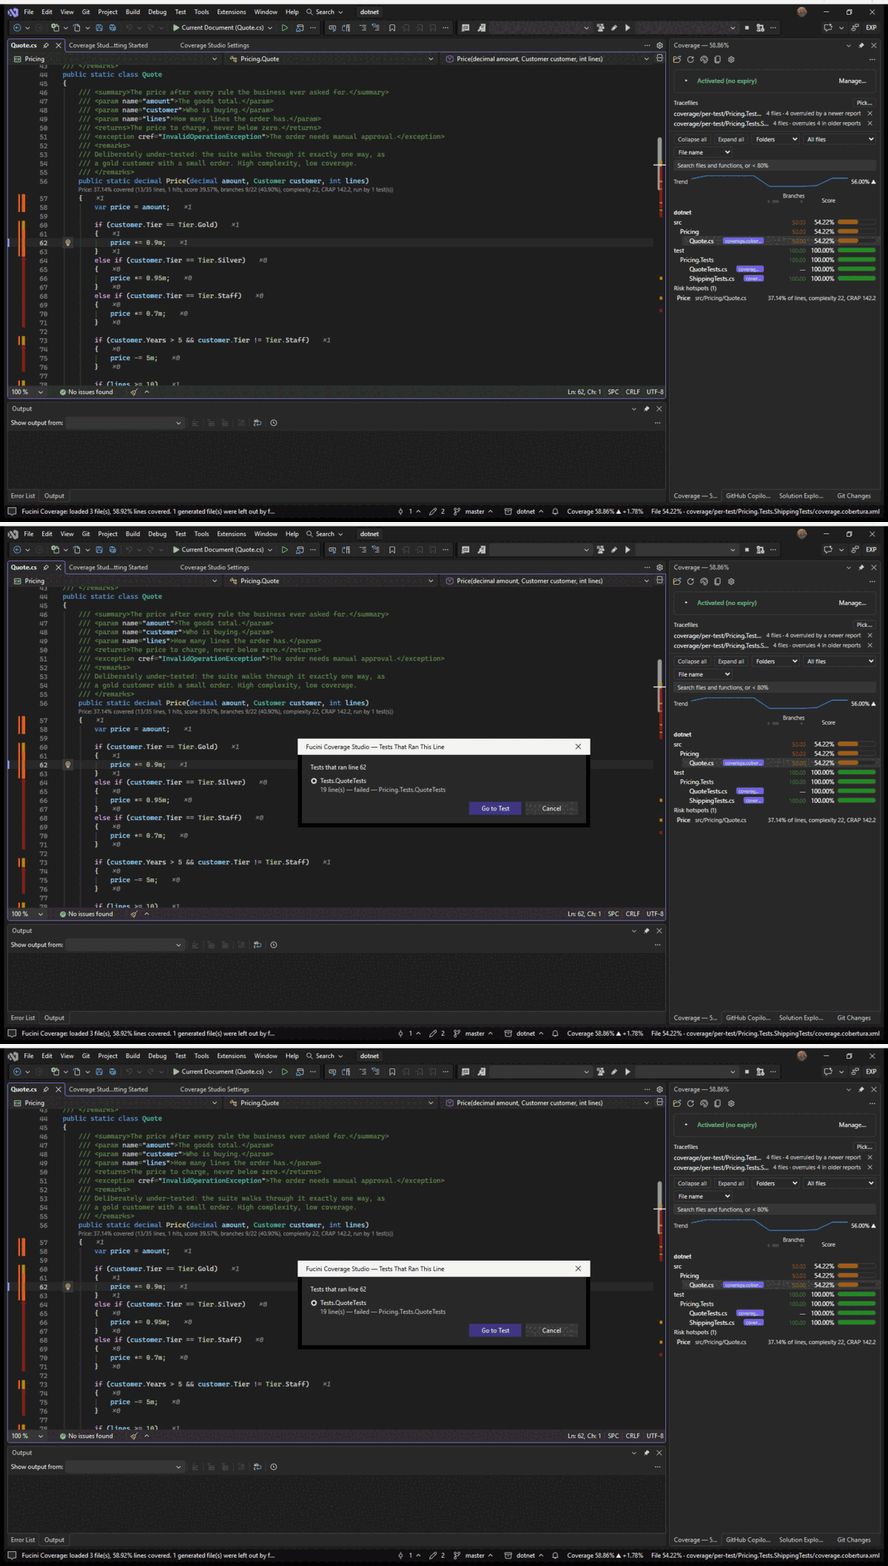 Screenshot pending — add assets/img/vs-pass-fail.gif (see SCREENSHOTS.md).
The tests a change touches
A full run answers slowly what Run Tests Affected by My Changes… answers at once: of all the tests, which went through the code I just edited? git is asked for the working tree's diff against testImpact.baseRef — HEAD by default, which is what is not committed yet; origin/main for everything the branch changes — and the tests that ran a changed line are listed, the one that ran most of the change first. Picking a test opens it. Where the reports came from a per-test run (testRun.perTest), the first entry runs only those tests, each class into its own report, so every other class's report stands and the totals stay the whole suite's. A test that only ran lines below an insertion or a removal is listed too: its report would otherwise name the wrong lines.
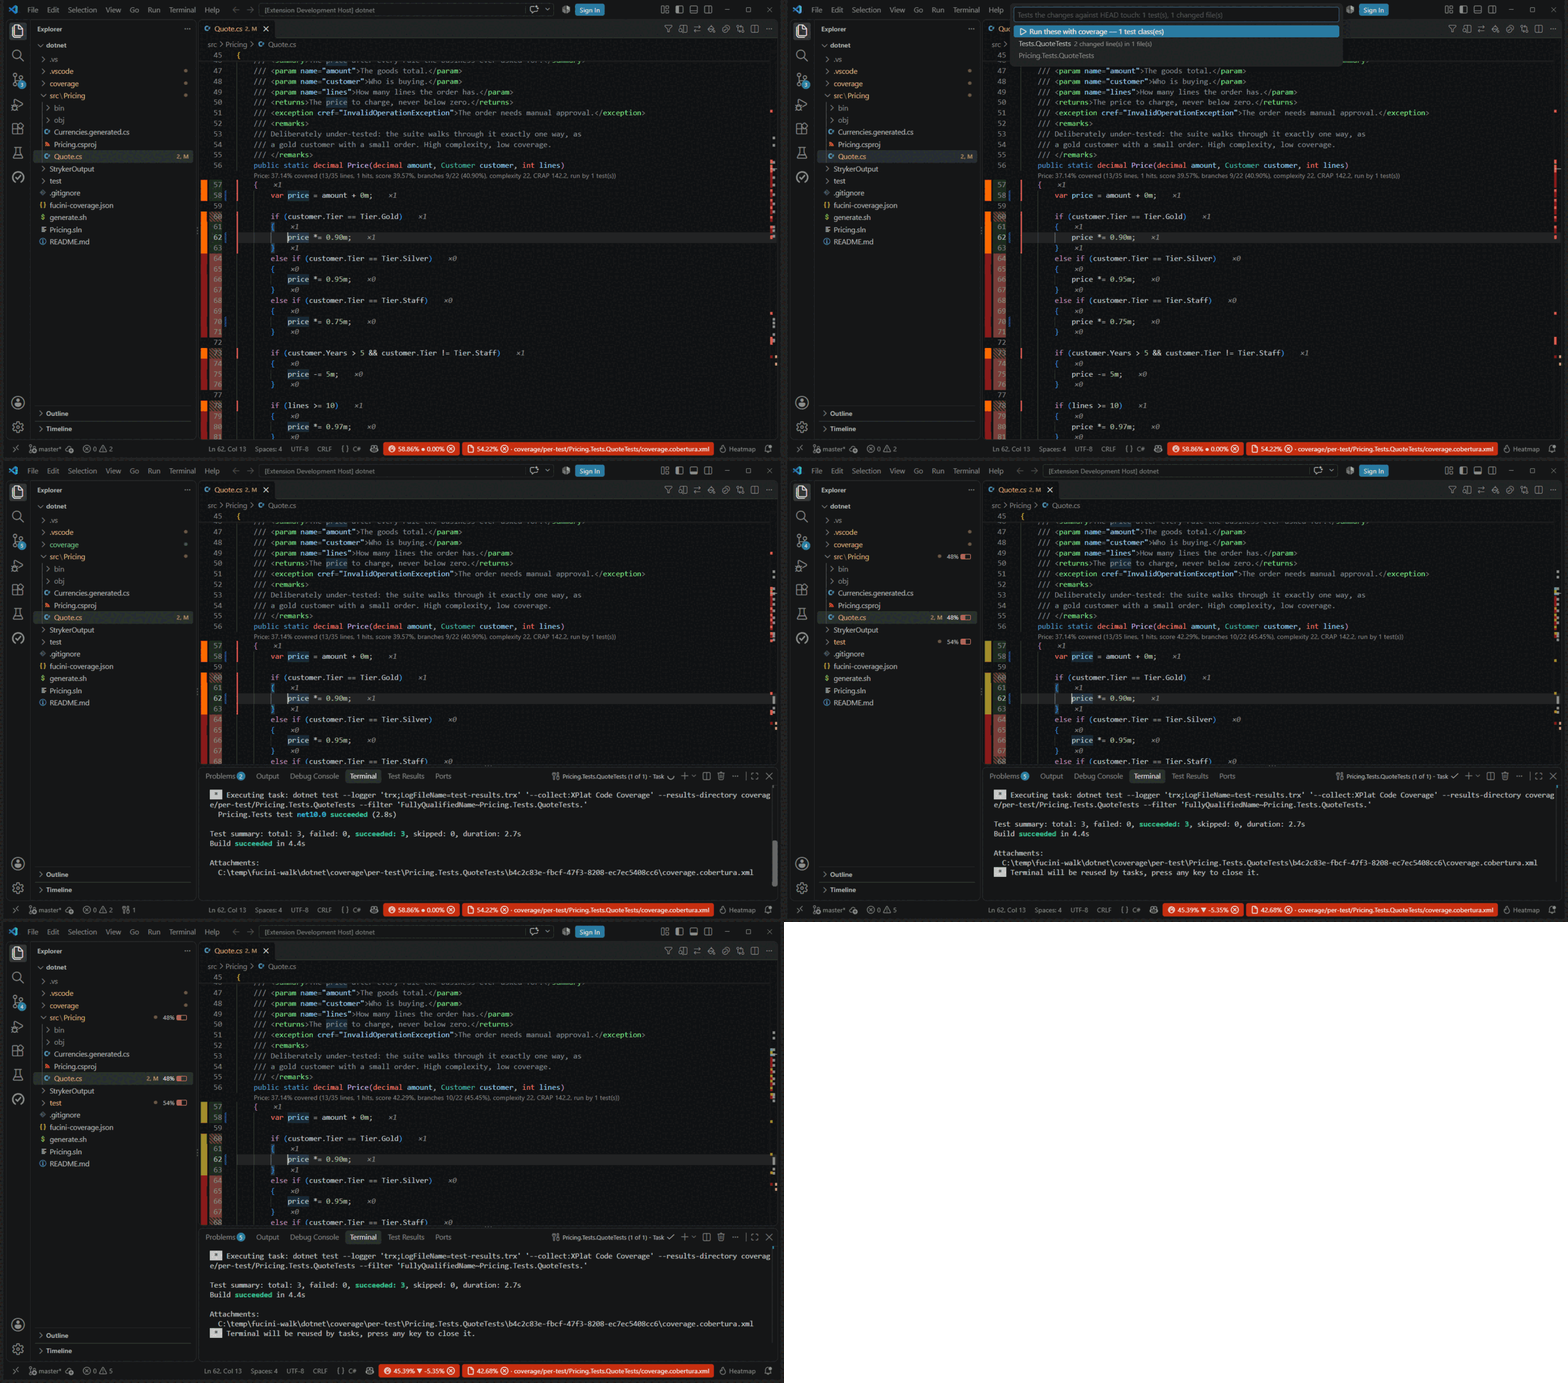 Screenshot pending — add assets/img/test-impact.gif (see SCREENSHOTS.md).
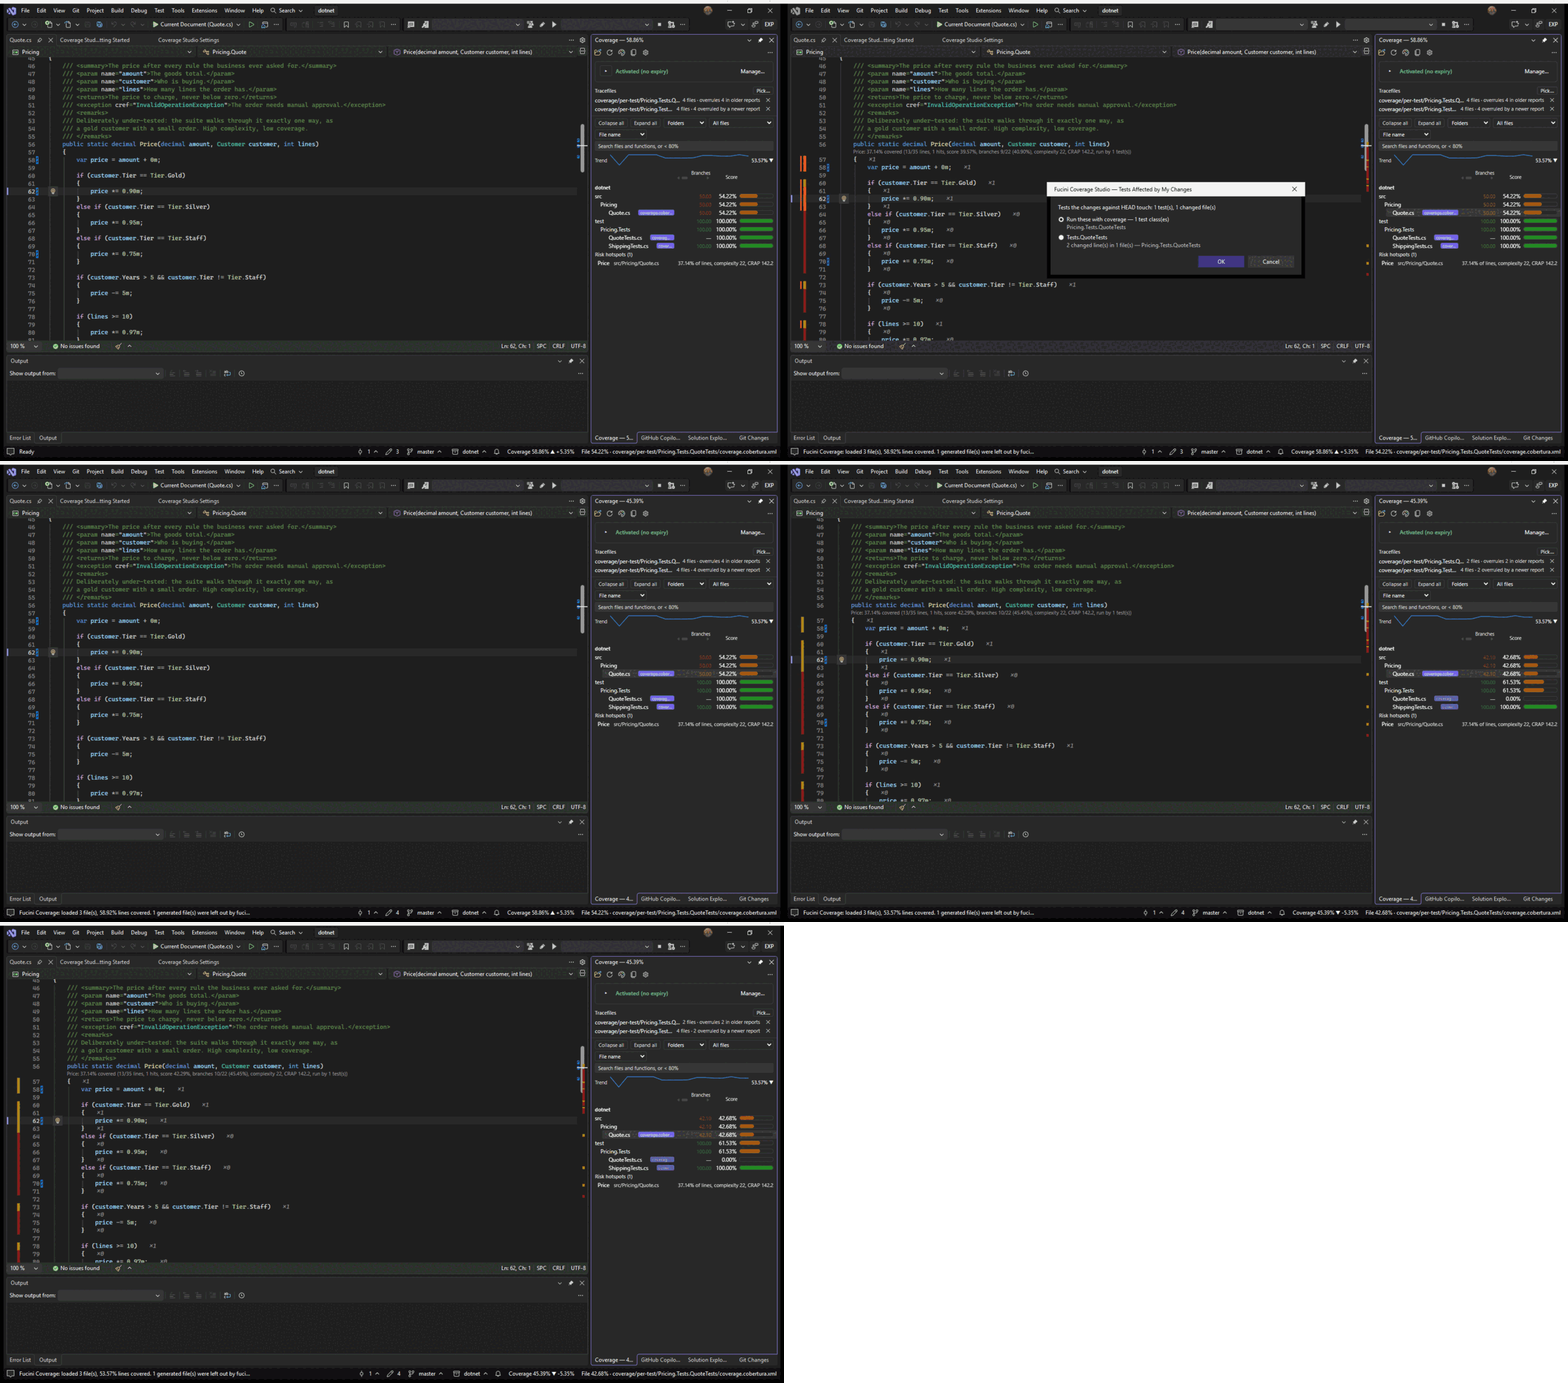 Screenshot pending — add assets/img/vs-test-impact.gif (see SCREENSHOTS.md).
The fewest tests that still run every line
Show Minimal Test Set… answers two questions from the same per-test lines: which few tests would still run every line the suite runs — for the quick run before a commit — and which tests run no line that another does not run already. The chosen tests come first, each with the lines it adds and the lines only it runs; then the rest, each marked as adding nothing. The choice is the greedy one — the test that runs most, then the one that adds most to that — so it is close to the smallest set and the same every time. Redundant by lines is not redundant by what a test checks: a test that adds no line may still be the only one that asserts a value on those lines. The list says where to look when a suite is pruned, never what to delete.
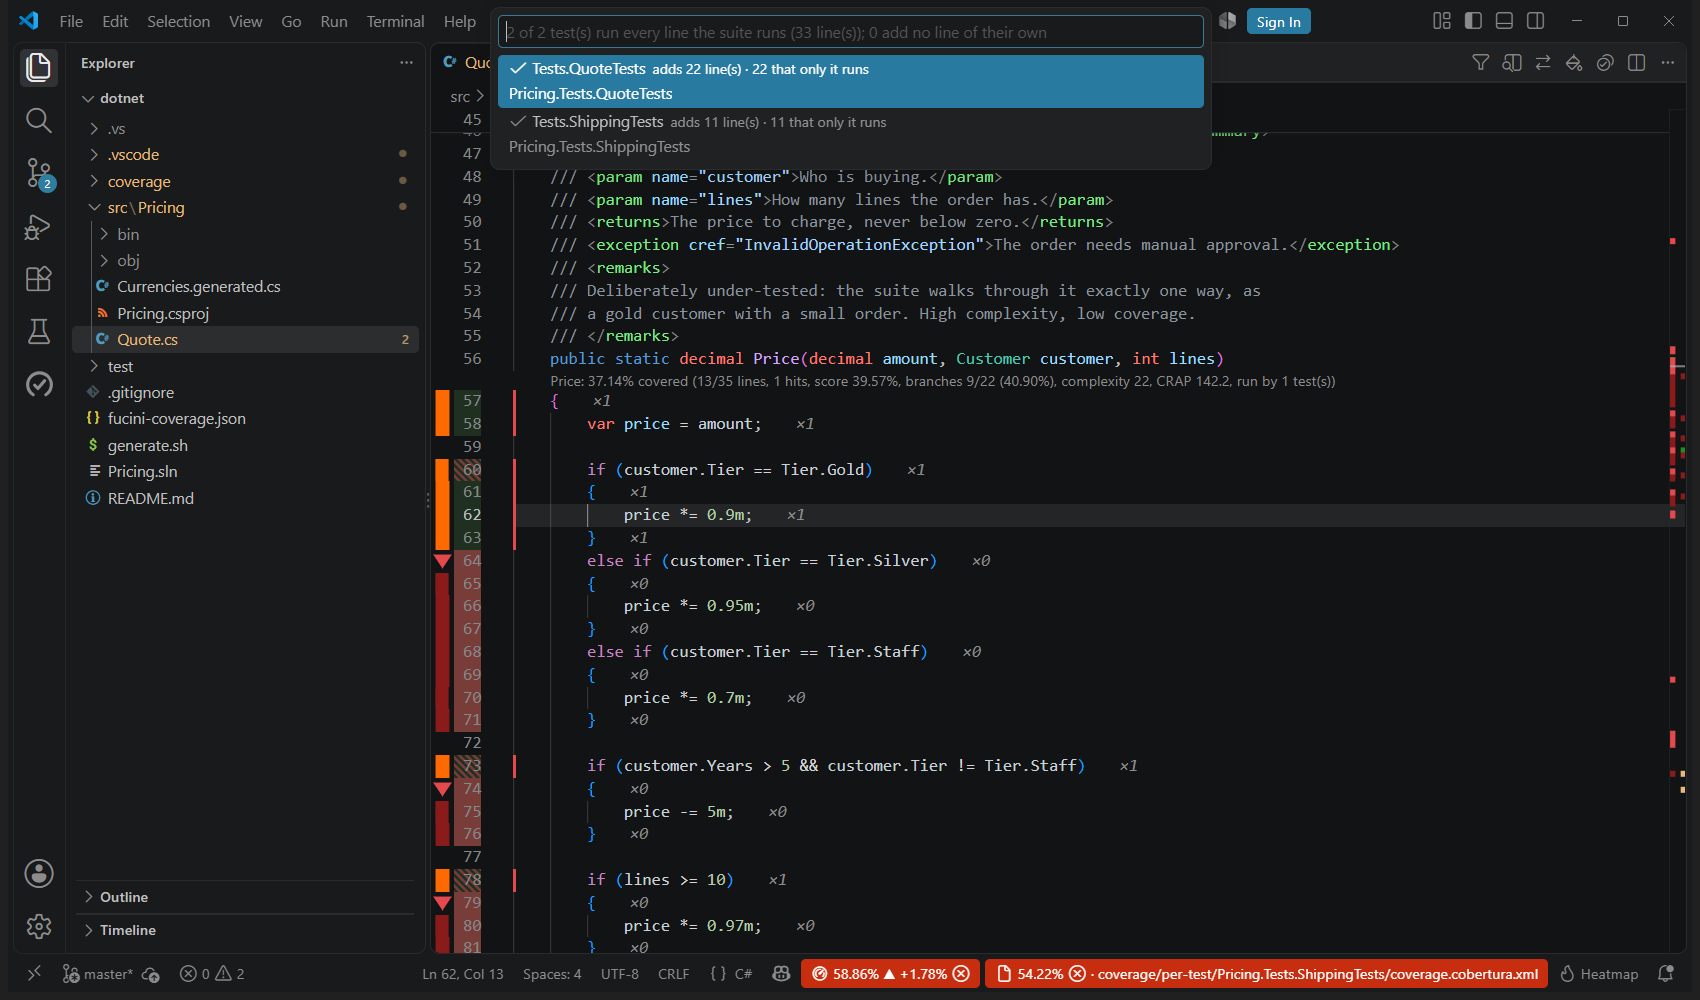 Screenshot pending — add assets/img/minimal-test-set.png (see SCREENSHOTS.md).
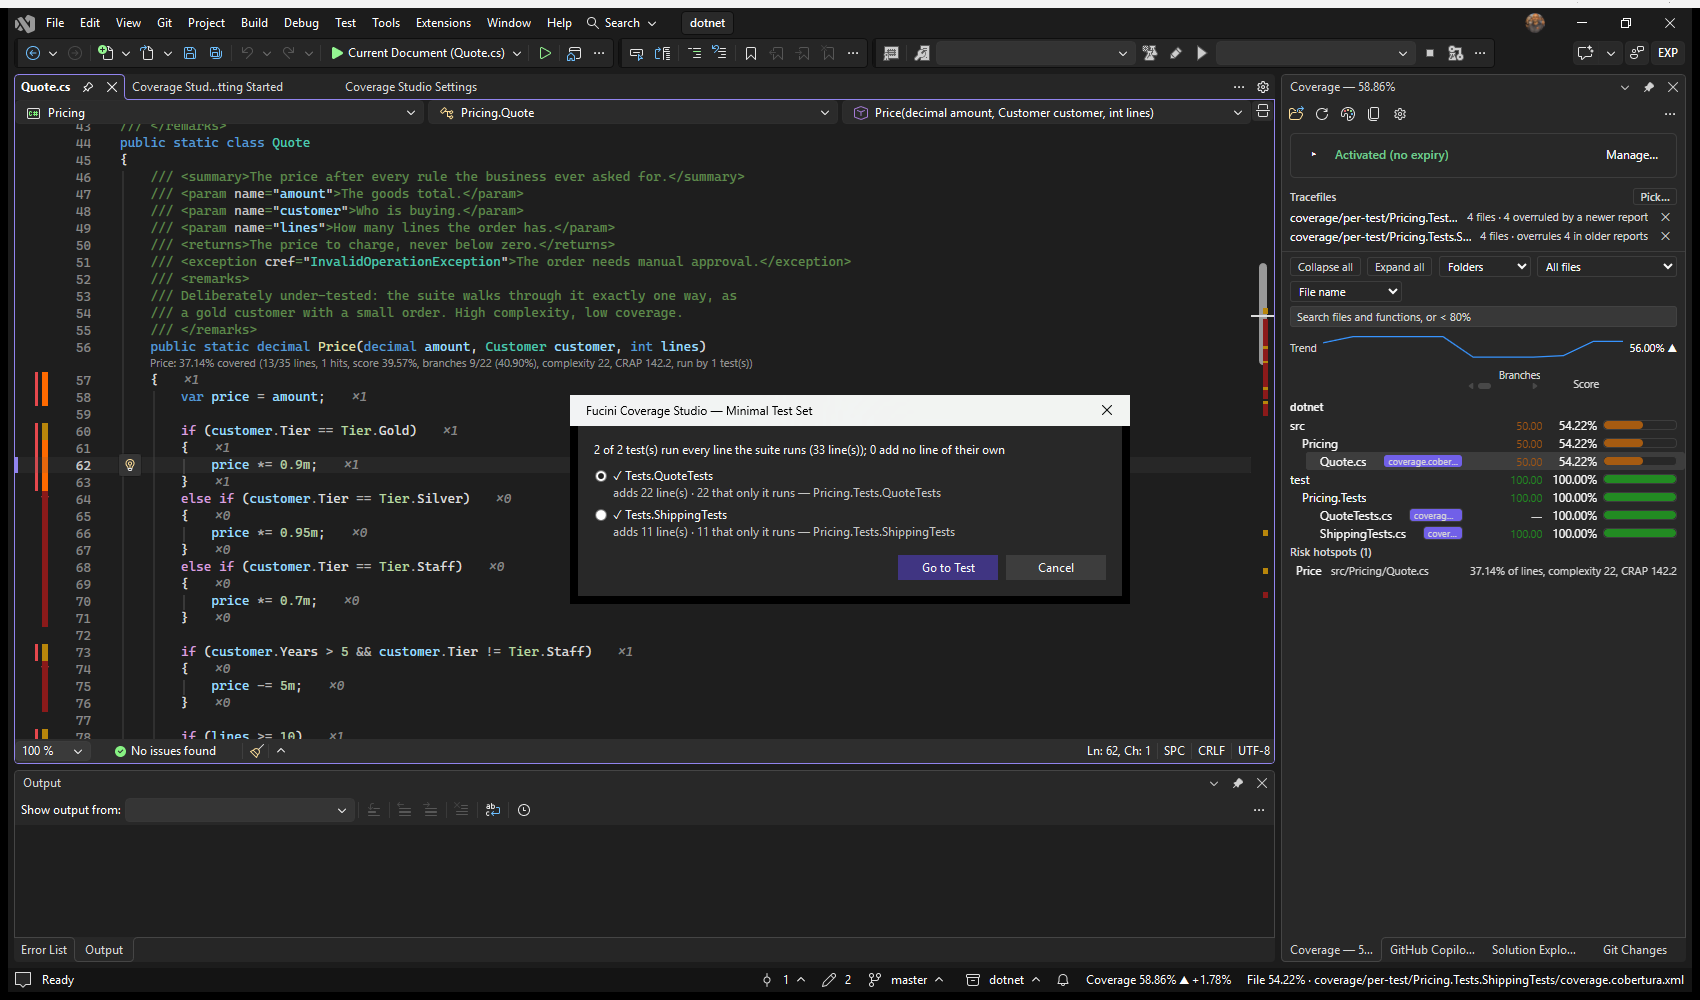 Screenshot pending — add assets/img/vs-minimal-test-set.png (see SCREENSHOTS.md).
Run this test, with coverage
Put the caret in a test and run Run This Test with Coverage — the Command Palette, the editor's context menu, in Visual Studio Tools → Coverage Studio or Ctrl+Shift+U, R — and that test alone runs with coverage on: the test method the caret is in, or the test class or describe block when it is between methods, or the file when it is above every class. What is under the caret is read off the text, so it works for C#, VB and F# ([Fact], [Test], [TestMethod] and the like), JavaScript and TypeScript (it, test, describe) and Python (def test_…) whatever language service is installed. The folder's recipe is narrowed to it — dotnet test --filter "FullyQualifiedName~…", jest or vitest <file> -t "…", a pytest node id — and what it wrote is loaded like any run; a runner that cannot be narrowed says so and Run Tests with Coverage runs them all.
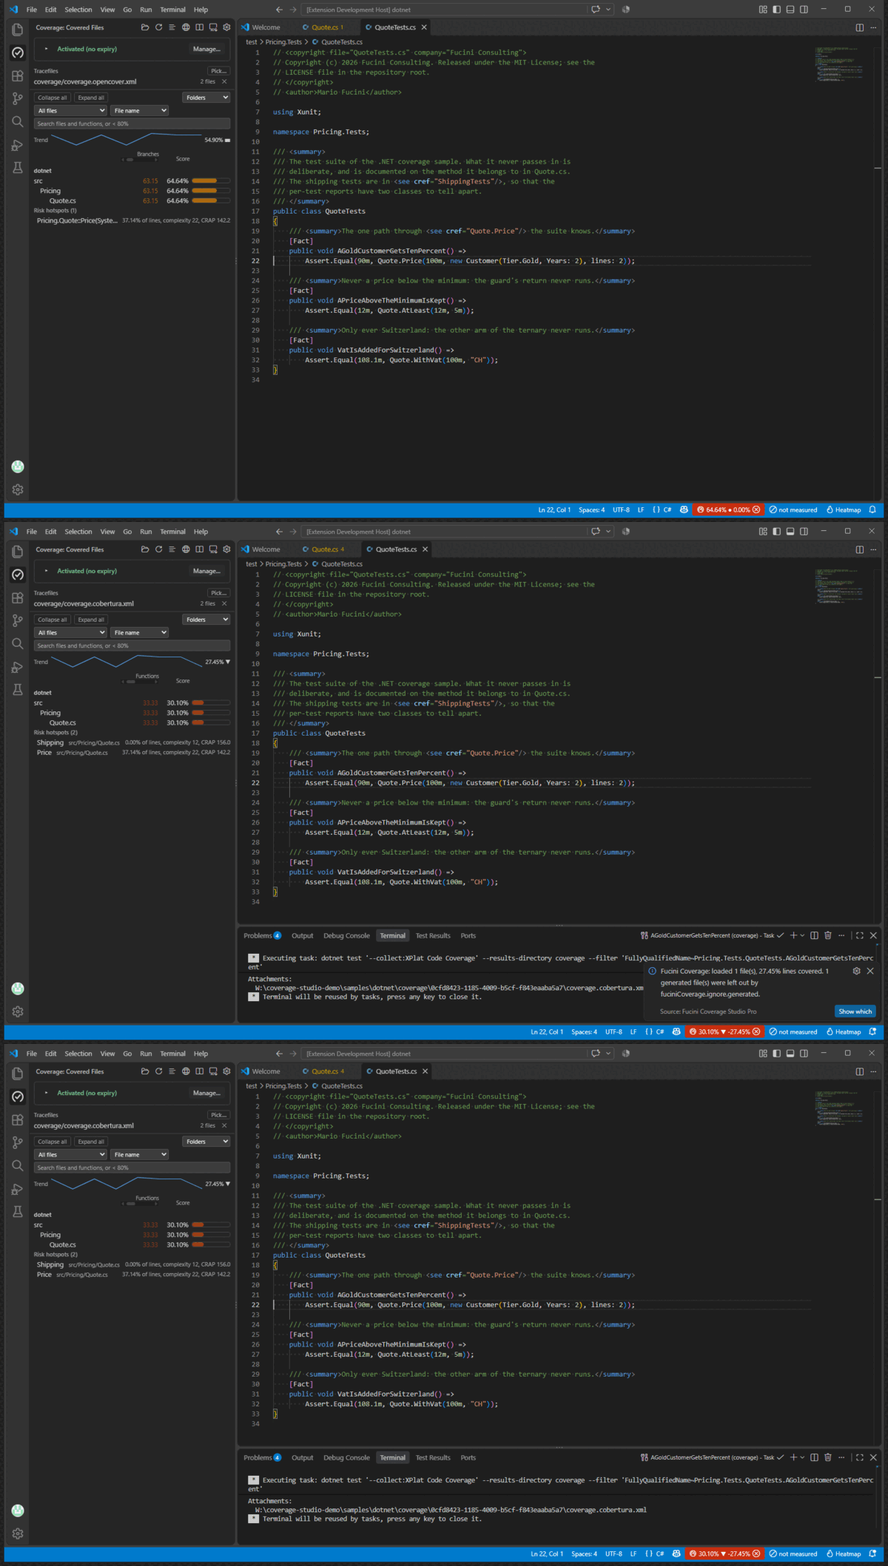 Screenshot pending — add assets/img/run-this-test.gif (see SCREENSHOTS.md).
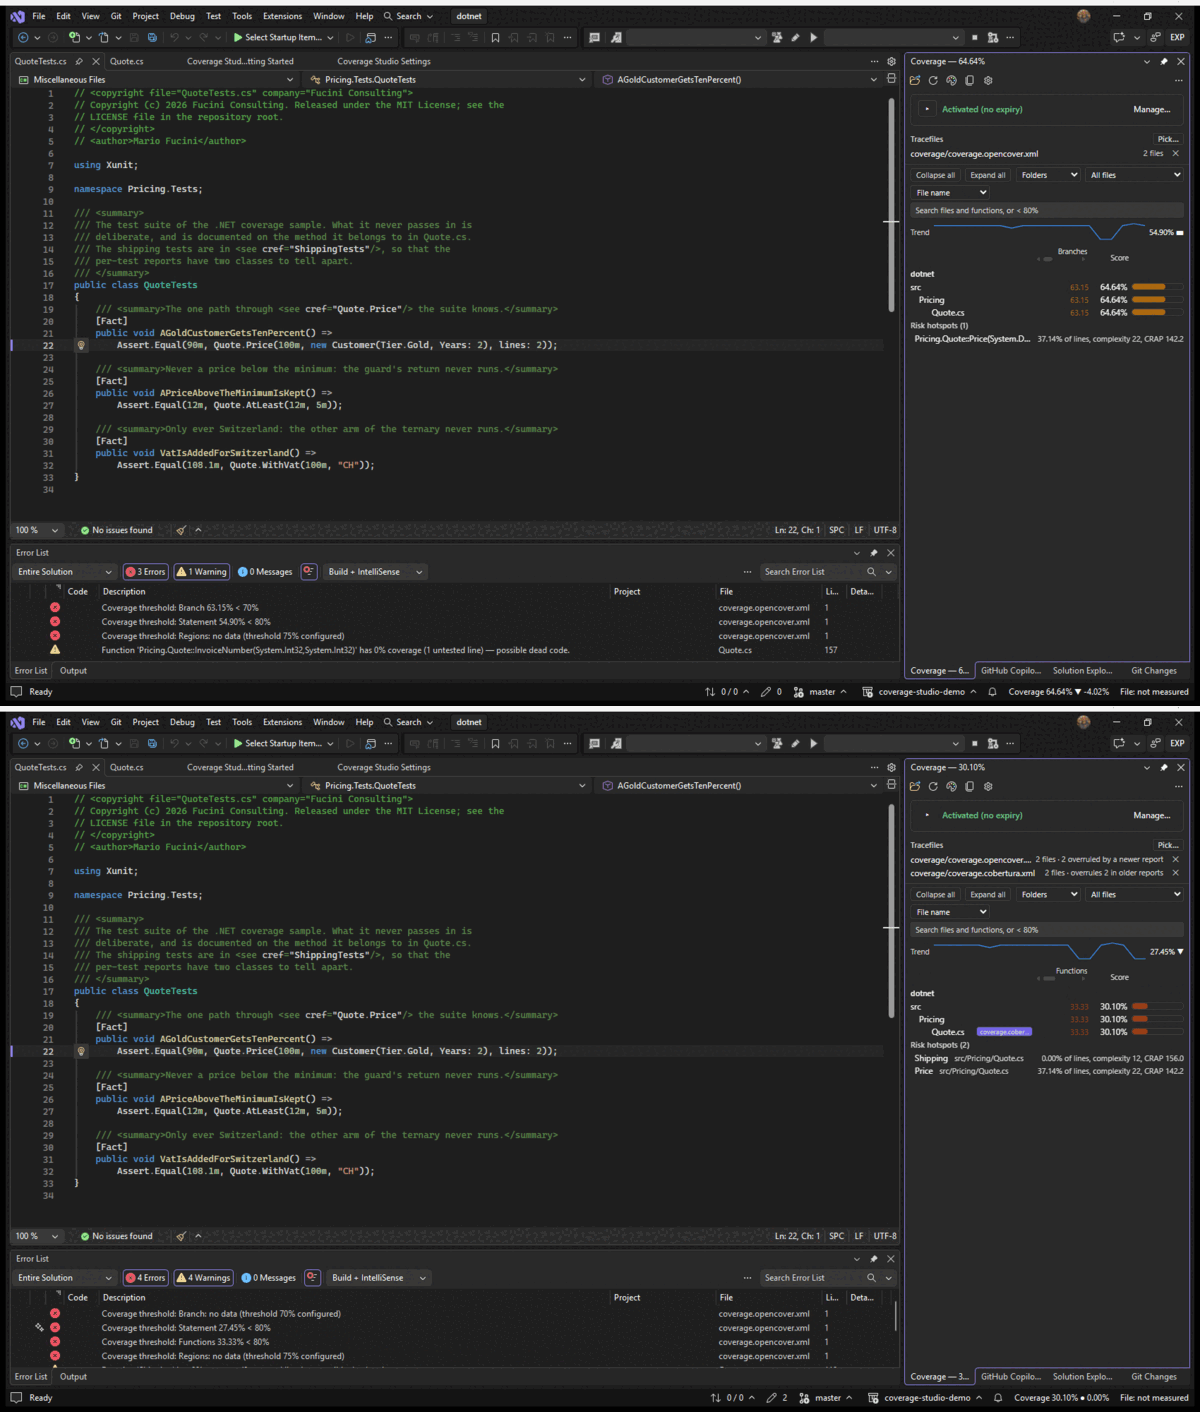
[Fact] — the run in the Tracefiles list, the lenses saying one test ran the code.Go and Rust. In a Go file the caret's func TestXxx (or Fuzz…, Example…) runs alone, in its own package and by its exact name — go test ./pkg/calc -run "^TestTotal$" — and outside a test the file's package runs. In a Rust file the #[test] function runs by its path in the crate with --exact; with the caret in a mod and in no test, that module's tests run; an integration test under tests/ runs in its own binary (--test api). A runner is only handed files of its own language: a TypeScript file in a Go folder gets a sentence, not a run of nothing.
On the Microsoft Testing Platform the run is the test project's own program and the filter is the framework's: xunit.v3's exact --filter-method for a test and --filter-class for a class — Ns.Quote no longer also runs Ns.QuoteBuilderTests — the VSTest --filter for MSTest and NUnit, TUnit's --treenode-filter. A nested class is Ns.Outer+Inner, as the test listing prints it, for the per-test mode too.
Coverage after every save
With testRun.onSave on, saving a source runs the tests that cover it, with coverage, a moment after the save, and the gutter follows. For a .NET solution the saved file's project is found through the .csproj graph and only the test projects that reference it — directly, or through other projects — are run, one dotnet test <project> each; any other runner runs its whole recipe; a file no project owns and no report measures runs nothing. Several saves in a row are one run, and a run already going is not interrupted. The rest is as Run Tests with Coverage does it: the terminal, the Output pane, the report loaded. Off by default — it is a habit to choose, not a default to discover.
{
"fuciniCoverage.testRun.onSave": true
}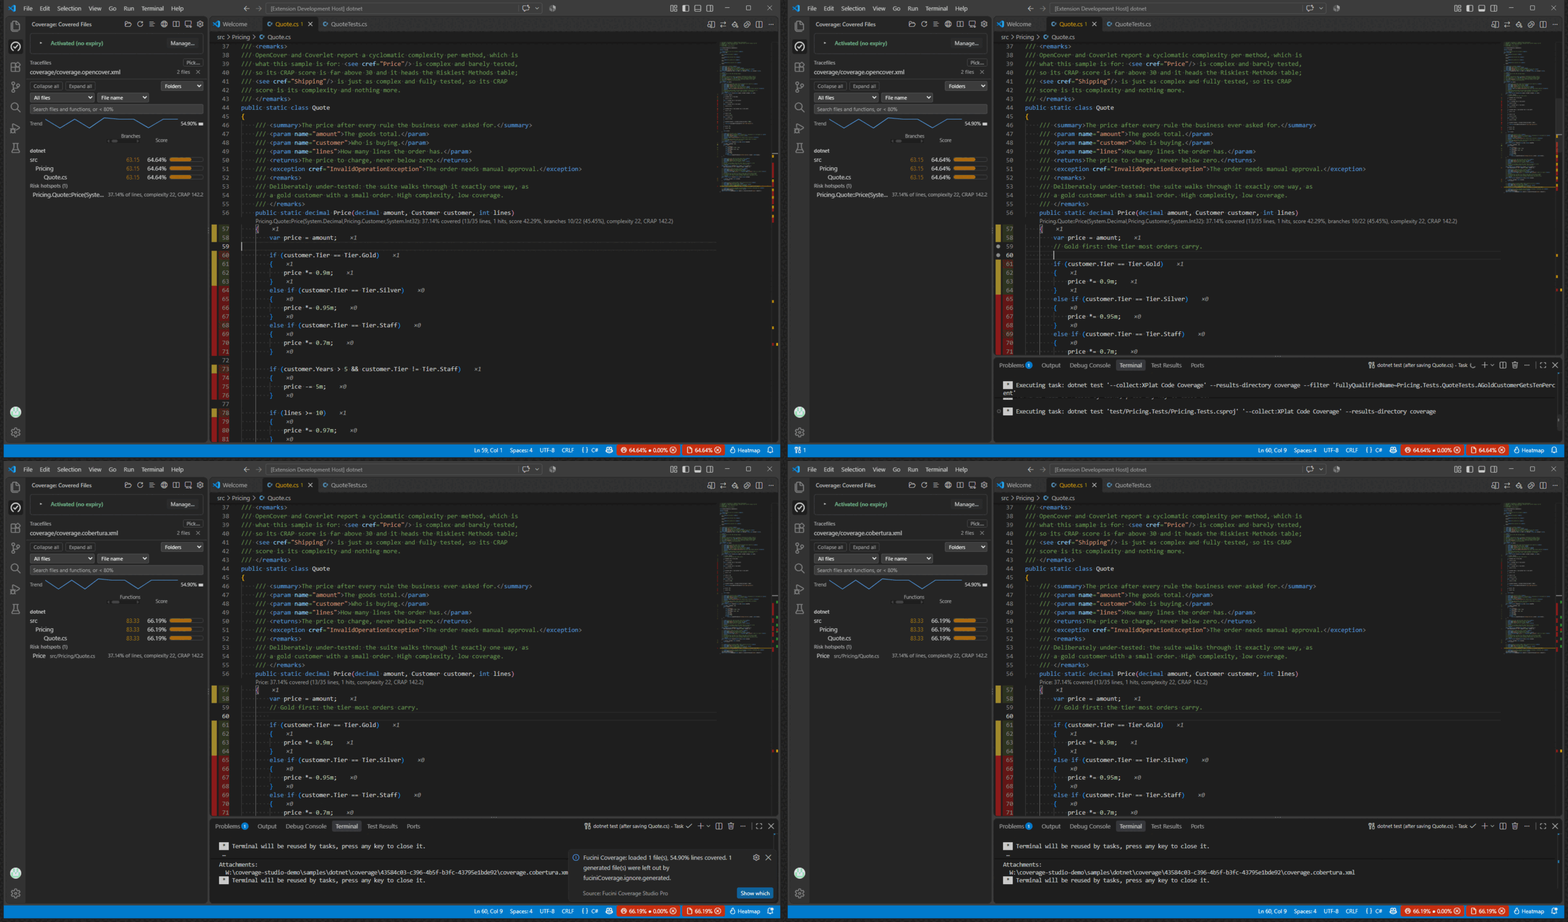 Screenshot pending — add assets/img/coverage-on-save.gif (see SCREENSHOTS.md).
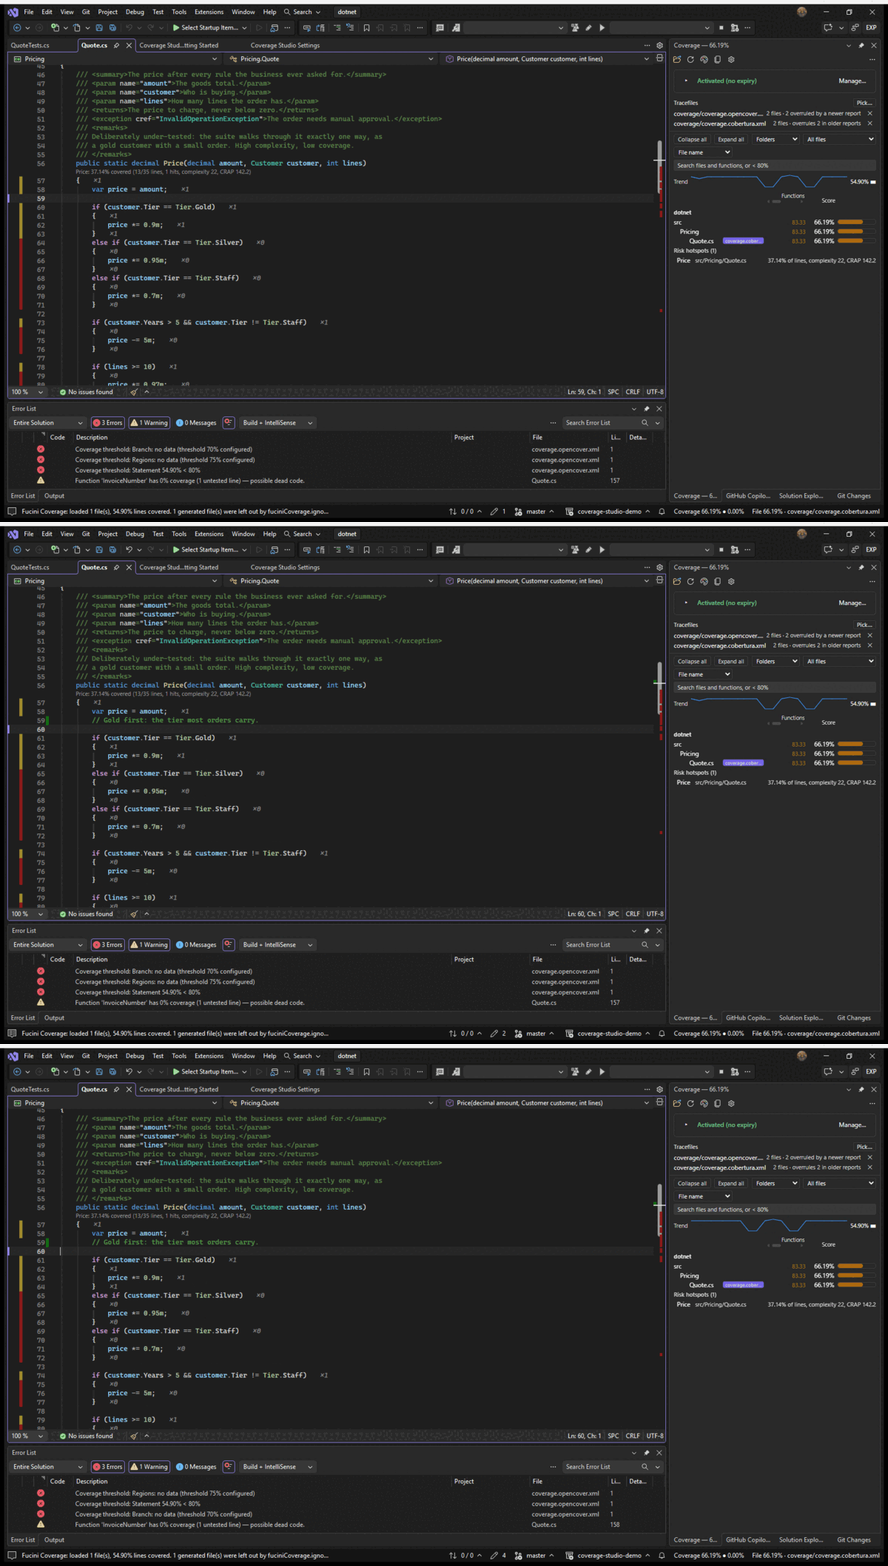
testRun.onSave on — Quote.cs saved, the tests running by themselves, the lens above the method changing.The app itself, with coverage
A test run says what the tests reach. What a person reaches — clicking through the screens before a release, replaying a customer's steps — is coverage too, and Run App with Coverage… collects it. The folder's .NET app — an Exe, a WinExe, a web or worker project, never a test project; a pick where there are several — is started under Microsoft's dotnet-coverage in a console of its own, so that a console app can be typed into, and runs until you close it. What you walked through is then loaded like any run, and in a coverage session it is added to what the tests ran. How the app ended is not held against the run. It needs the tool once: dotnet tool install --global dotnet-coverage.
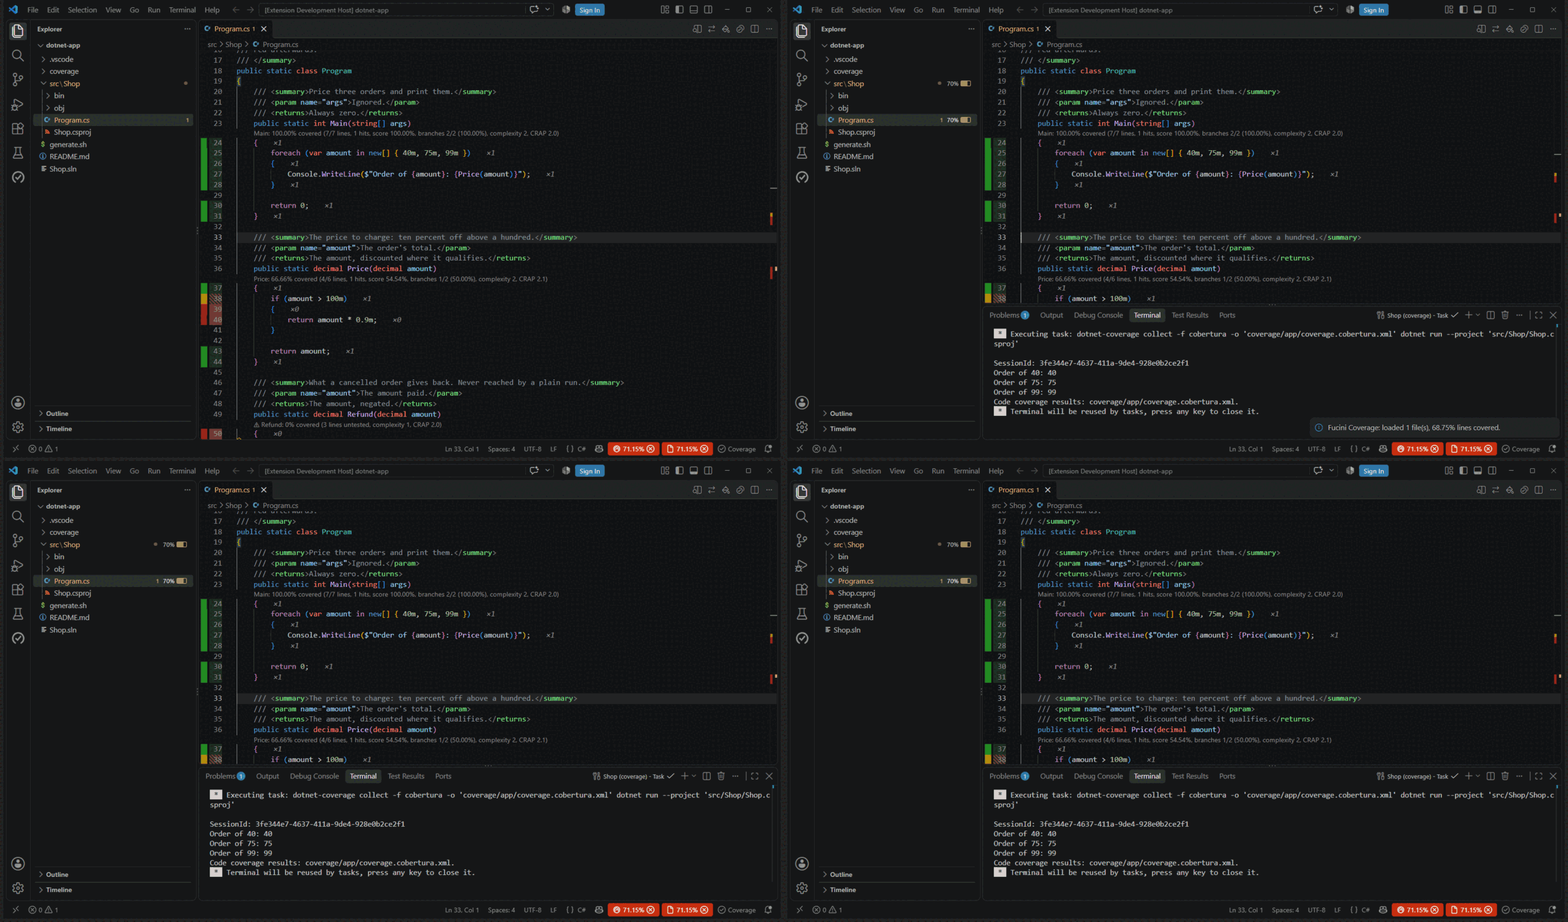 Screenshot pending — add assets/img/run-app.gif (see SCREENSHOTS.md).
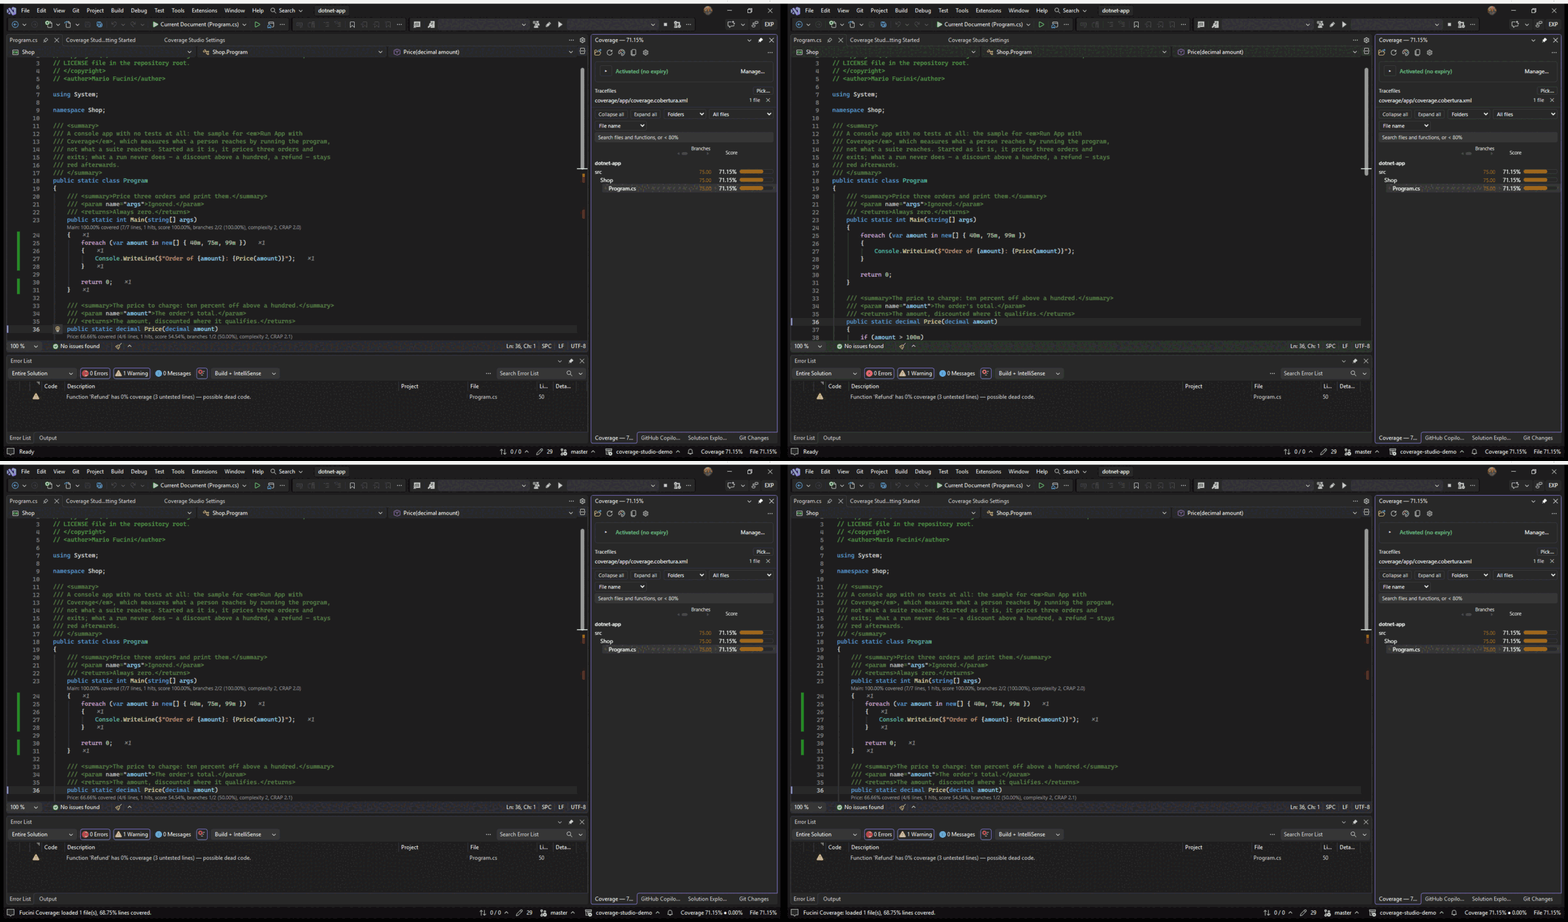 Screenshot pending — add assets/img/vs-run-app.gif (see SCREENSHOTS.md).
Mutants, where they are
A mutation tool — PIT for Java, Stryker for JavaScript, C# and Scala, Mull for C and C++ — changes your code in small ways and runs the tests against each change. A change no test notices is a surviving mutant: the code ran, and nothing checked what it did. The mutation score says how many were caught; since 0.2026.83 the editor says where the others are. A line with one carries a note after it (⚑ 2 mutants survived), the changed text is underlined where the report says which text that was (Stryker and Mull do), the overview ruler has a stripe, and hovering shows what was changed, how many tests ran it, and for the mutants that were caught, which test caught them.
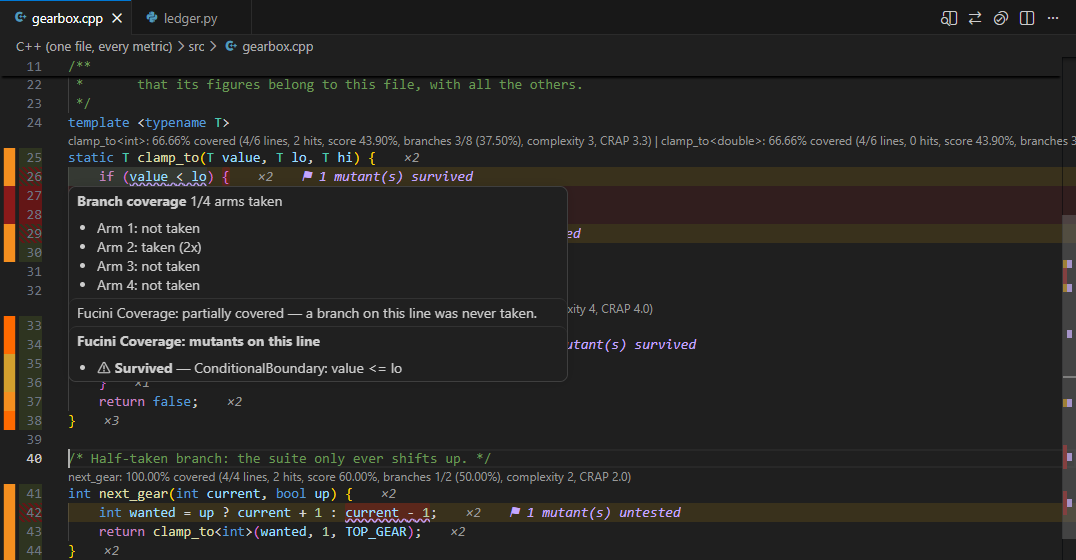 Screenshot pending — add assets/img/mutant-hover.png (see SCREENSHOTS.md).
Survived means tests ran the changed code and all passed. Untested (the report's no coverage) means no test runs that code at all, so nothing could have noticed. Mutants that were caught are counted on hover and never marked, and mutants that were never a fair test — one that would not compile — are outside the score. The annotated source has a row under each such line and a Next Mutant button (U), and the HTML reports have a Surviving Mutants section that links to the line. Nothing needs switching on, and a project without a mutation report sees nothing of it.
 Screenshot pending — add assets/img/mutants.gif (see SCREENSHOTS.md).
Would a test notice? A mutation run at the caret
A project's mutation run takes an hour; one function's takes a minute. Run Mutation Tests Here runs that minute: the function the caret is in — or the lines selected, or the file — is what the folder's mutation runner is told to mutate, and its report is loaded beside the coverage on screen, where the surviving mutants are marked. For C# it is Stryker.NET (dotnet tool install --global dotnet-stryker), told the span of characters and the test project that reaches the file's project; for JavaScript and TypeScript StrykerJS, told the lines; for Java PIT with Maven, told the class. How the runner ended is not held against the run: a score under its threshold is an exit code, and still a report. A runner that wrote nothing is said, with what it needs installed.
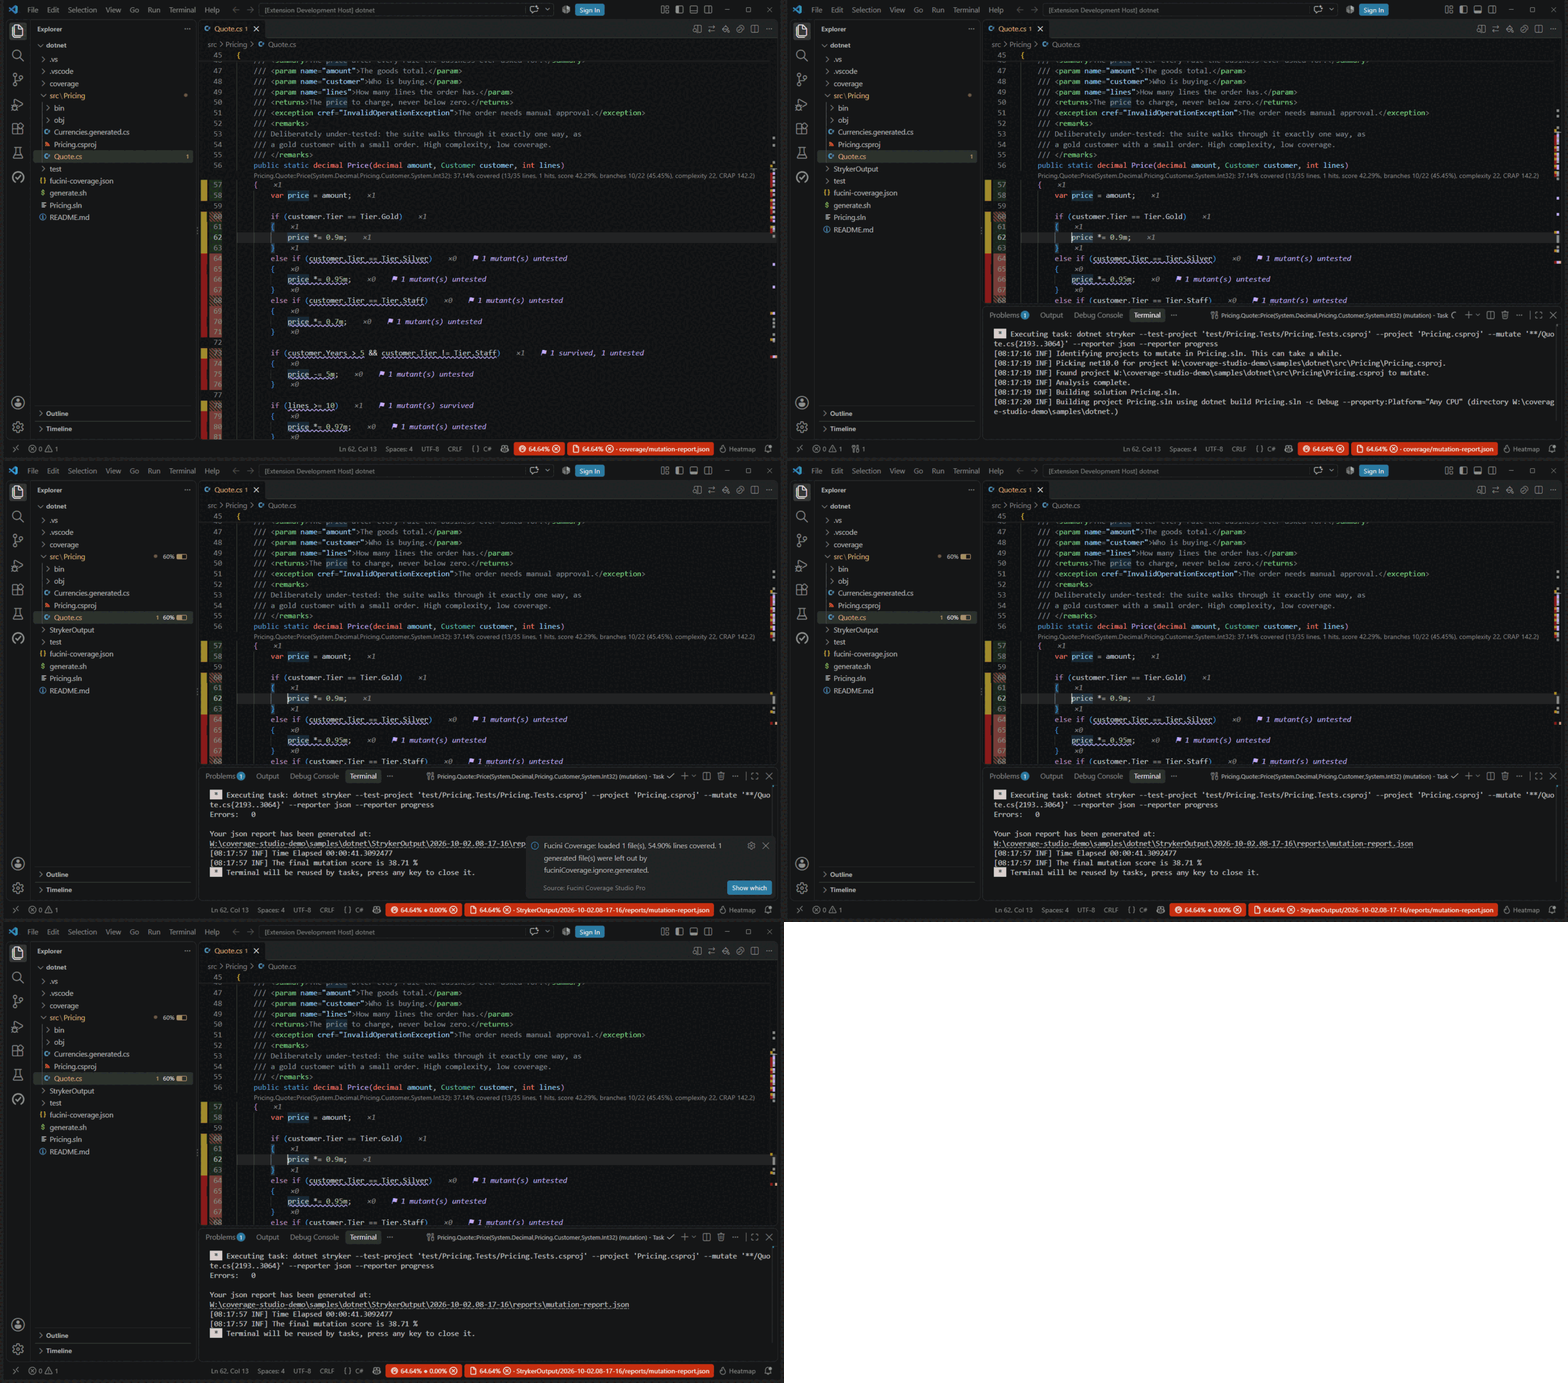 Screenshot pending — add assets/img/mutation-here.gif (see SCREENSHOTS.md).
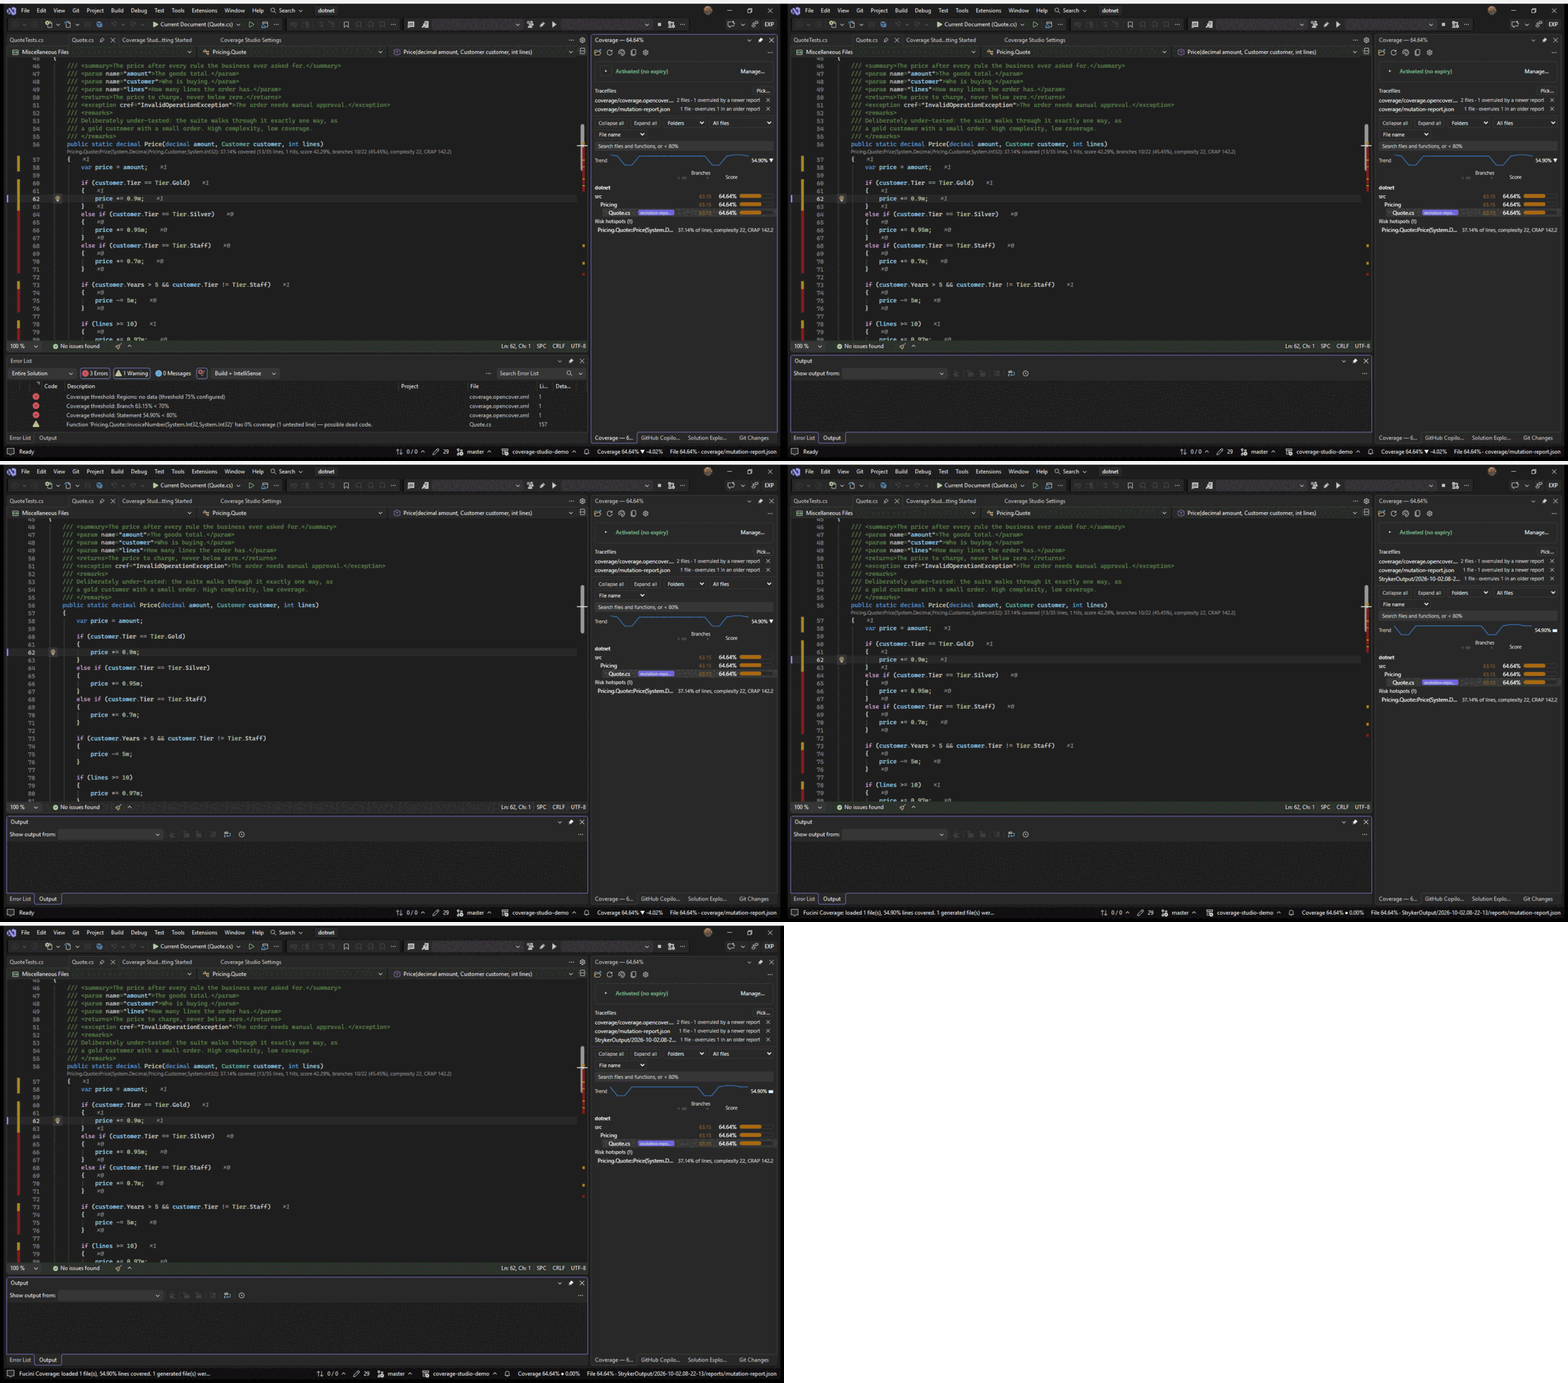 Screenshot pending — add assets/img/vs-mutation-here.gif (see SCREENSHOTS.md).
VS Code's own Test Coverage view
With testCoverage.publish on (the default), every loaded run also goes to the editor's native Test Coverage view — the Test Explorer's coverage panel, the per-file percentages it puts in the Explorer, and the editor's own Show Inline Coverage toggle — as lines, branch arms and functions, with the details loaded on demand, whatever tracefile they came from and with no test adapter involved. Show in Test Coverage View publishes the active run and opens the panel whatever the setting says; the status-bar menu offers it behind quickActions.showTestCoverage. Off, no Fucini Coverage entry appears in the Test Explorer at all. When a tracefile names its tests (lcov’s TN: sections), each test appears under Fucini Coverage in the Test Explorer and the view can filter a file’s coverage by test.
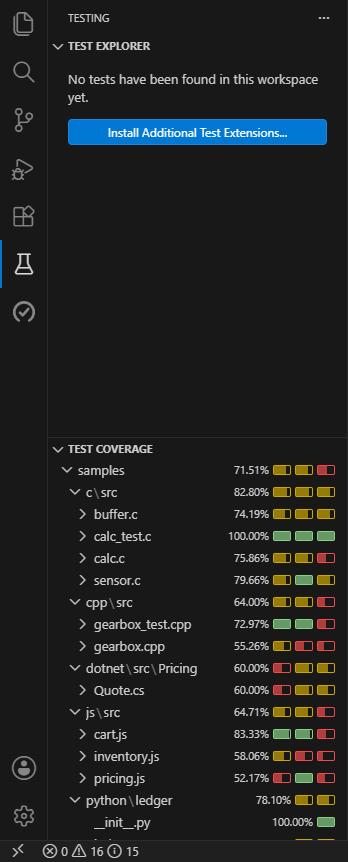 Screenshot pending — add assets/img/test-coverage-view.png (see SCREENSHOTS.md).
Uncovered lines in the Problems panel
Off by default because it is noisy by nature, and only ever for the documents that are open — a two-thousand-file run cannot flood the panel. Independent of problems.enabled, which keeps to one entry per file:
{
"fuciniCoverage.problems.perLine": "uncoveredAndPartial"
}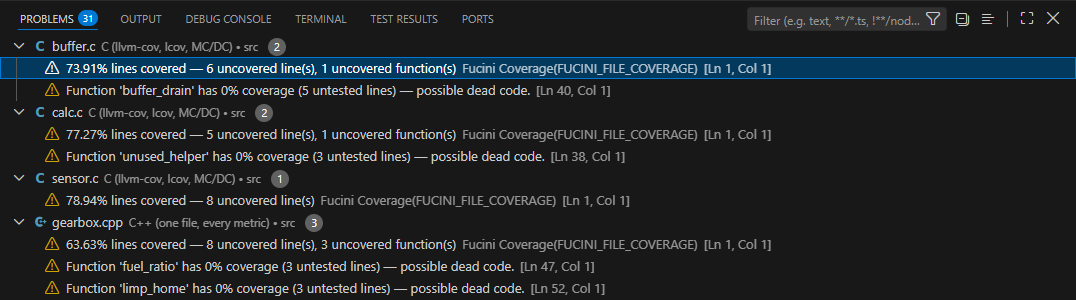 Screenshot pending — add assets/img/problems-panel.png (see SCREENSHOTS.md).
9. Diff coverage
Restrict decorations to lines that changed versus a git base ref — ideal for reviewing exactly what a PR did or didn't cover:
{
  "fuciniCoverage.gitDiff.enabled": true,
  "fuciniCoverage.gitDiff.baseRef": "origin/main"
}
Choose Diff Base… picks the ref from the repository's own branches and tags — the ref in force first, then the local branches, then the remote ones — with a last entry for typing a tag, a commit or any other ref, and writes it to gitDiff.baseRef for the folder. Diff coverage, the new-code gate and the indirect changes all diff against it; a base spelled wrong by hand (origin/main where the remote has master) gave a diff of nothing and said nothing. In Visual Studio the command is under Tools → Coverage Studio, and the list comes from git for-each-ref.
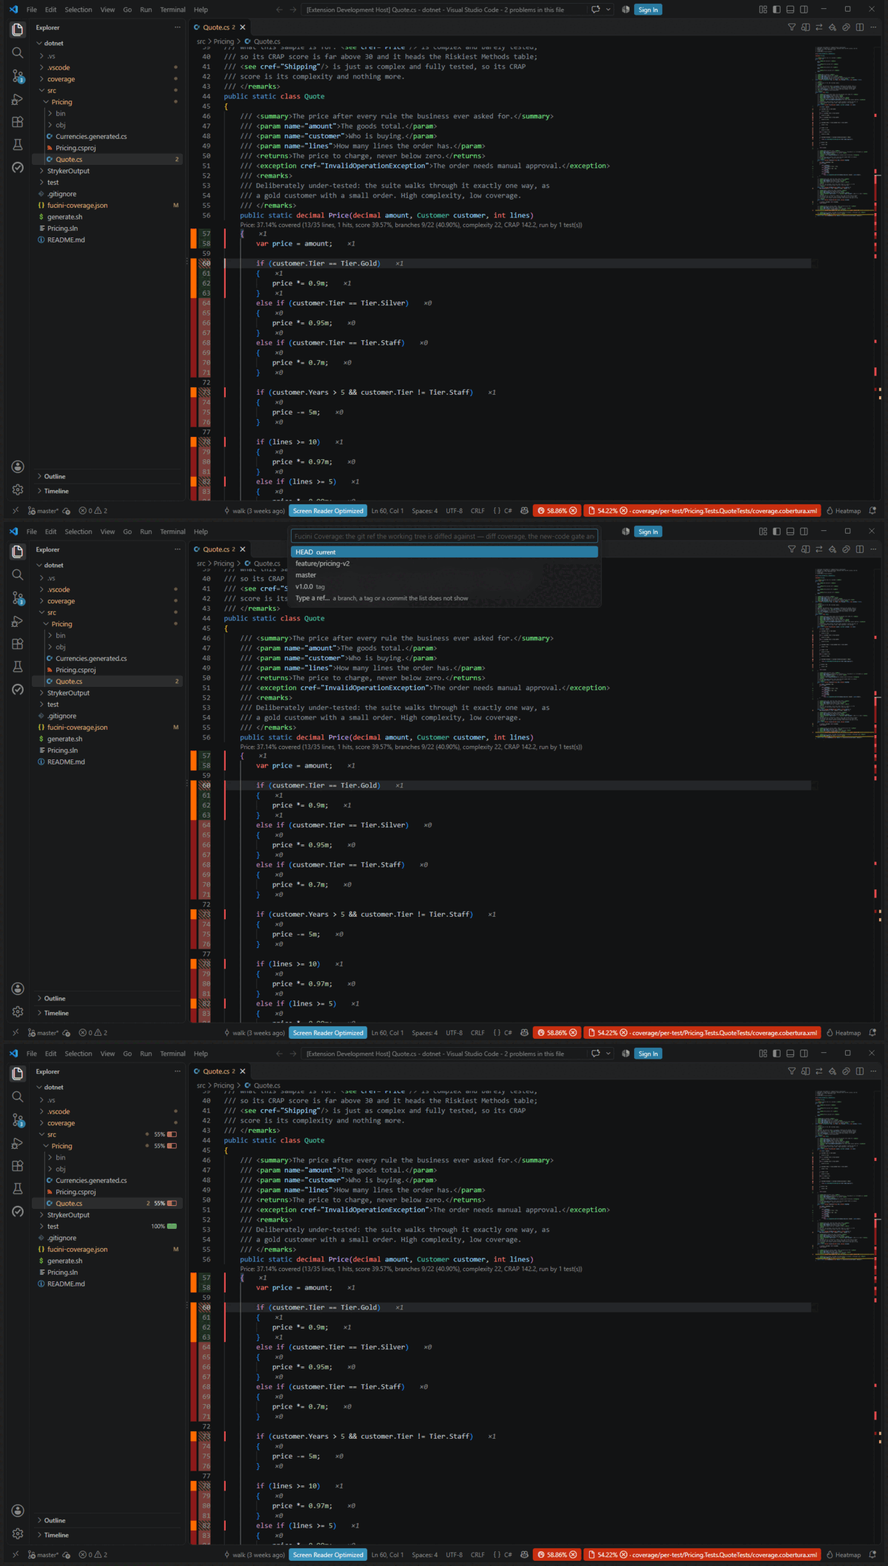 Screenshot pending — add assets/img/choose-diff-base.gif (see SCREENSHOTS.md).
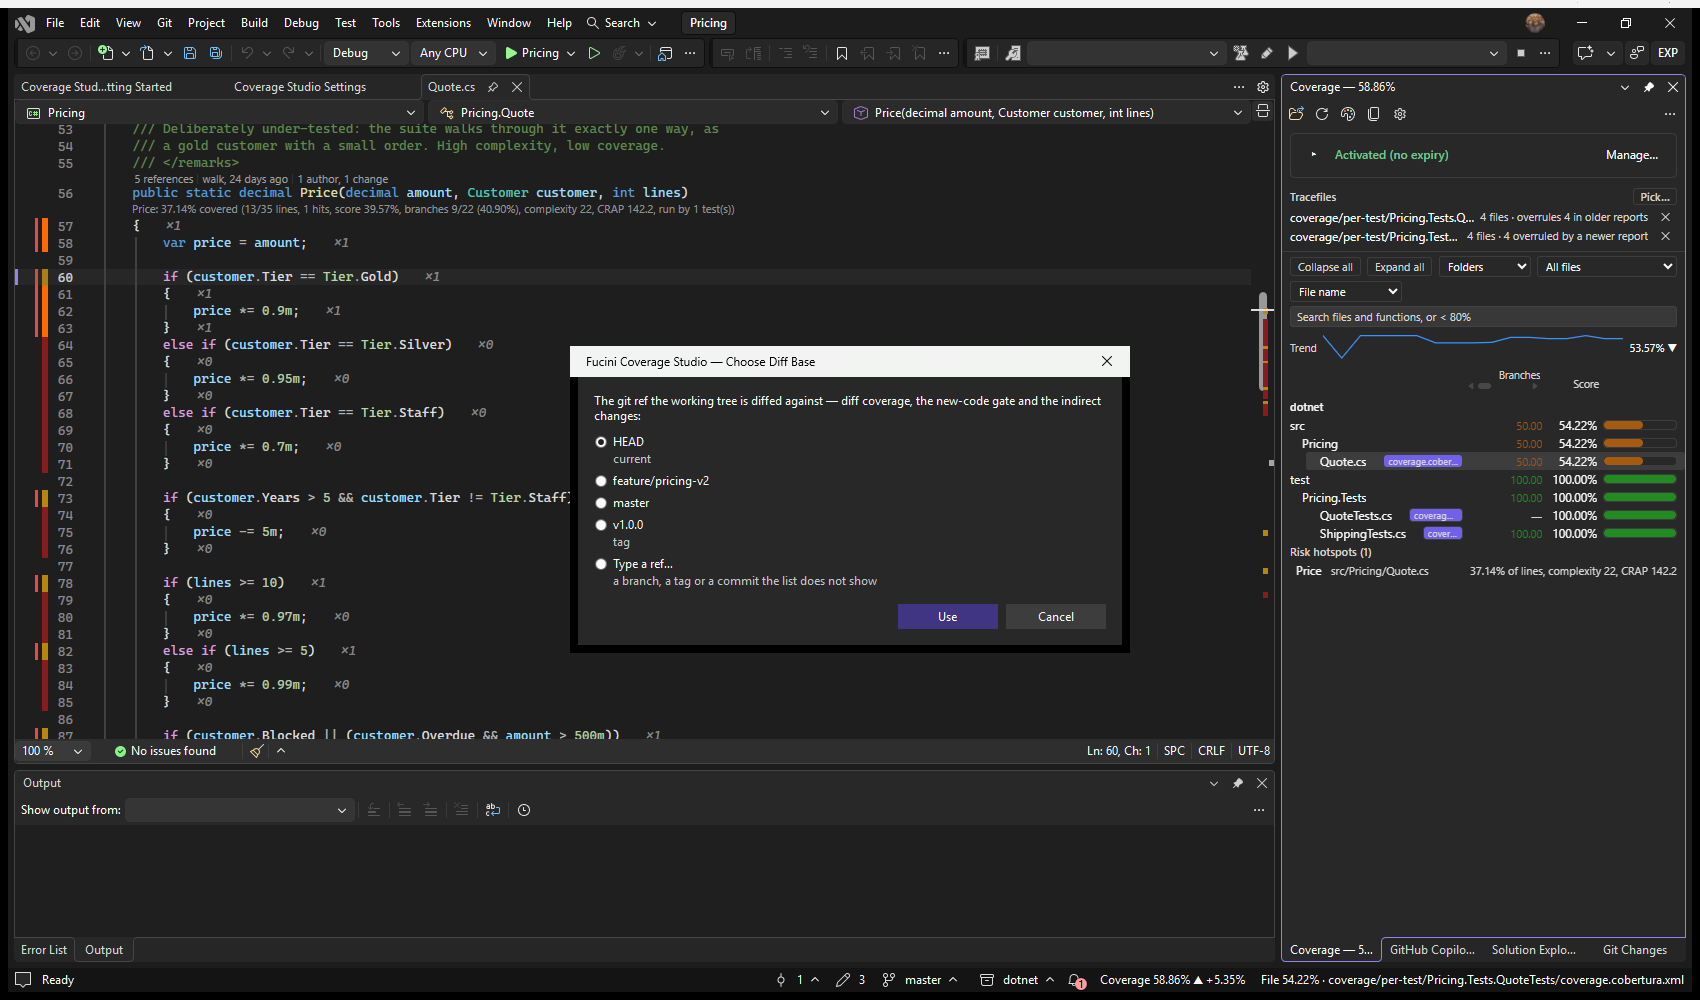 Screenshot pending — add assets/img/vs-choose-diff-base.png (see SCREENSHOTS.md).
git for-each-ref.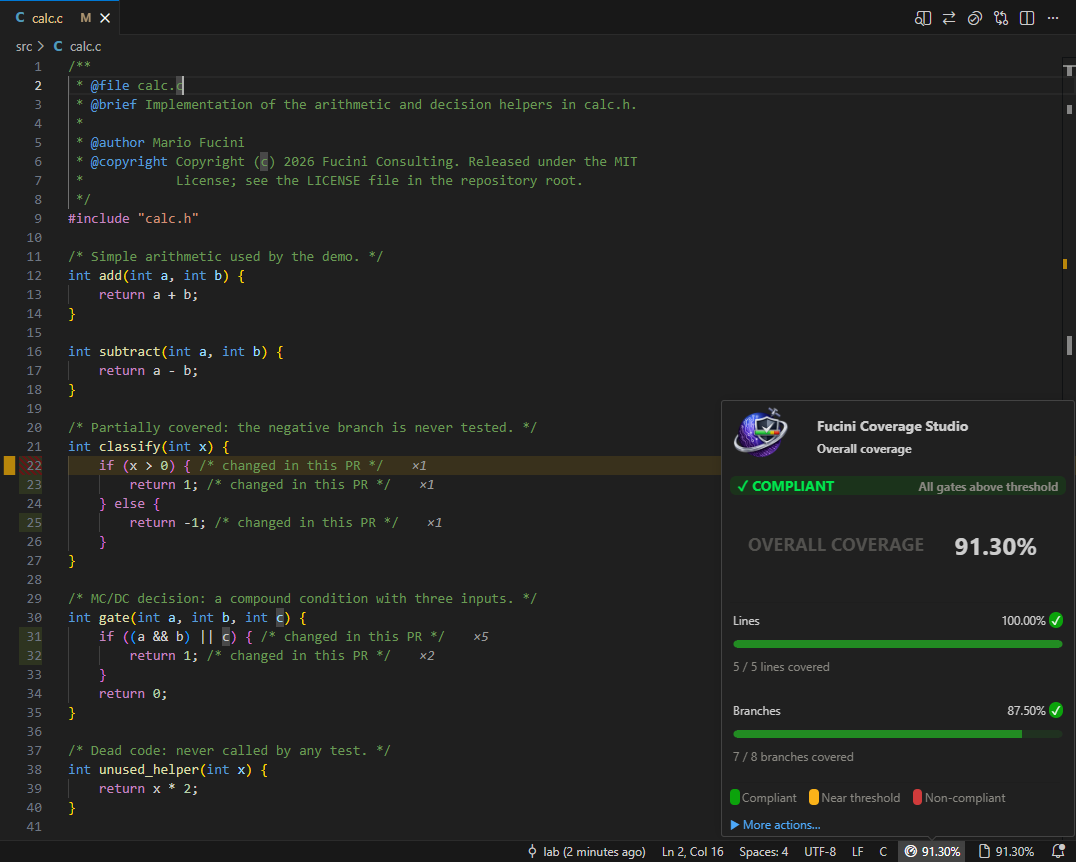 Screenshot pending — add assets/img/diff-coverage.png (see SCREENSHOTS.md).
In Visual Studio. The same two settings, read from the same files: the extension runs git diff <baseRef> itself for every file of the run and cuts the run down to the lines your branch changed — in the margin, in the Coverage window and in the gates. The Output pane says what git answered when it answers nothing.
A gate on new code
threshold.newCode is a gate of its own, beside the ones on the whole run: of the lines changed against gitDiff.baseRef that can be measured, the least percentage that must have run. A project at 62% overall can still ask that what is written today is tested. It is counted at every load on the whole run, which stays on screen — gitDiff.enabled is the other thing, the changed lines in the place of the run. Check Coverage Thresholds and the compliance entries in Problems fail it in a sentence of its own: New code 72.00% < 80% (18 of 25 line(s) changed against origin/main ran). A change with no line that can be measured — comments, a README — fails nothing.
{
"fuciniCoverage.threshold.newCode": 80,
"fuciniCoverage.gitDiff.baseRef": "origin/main"
}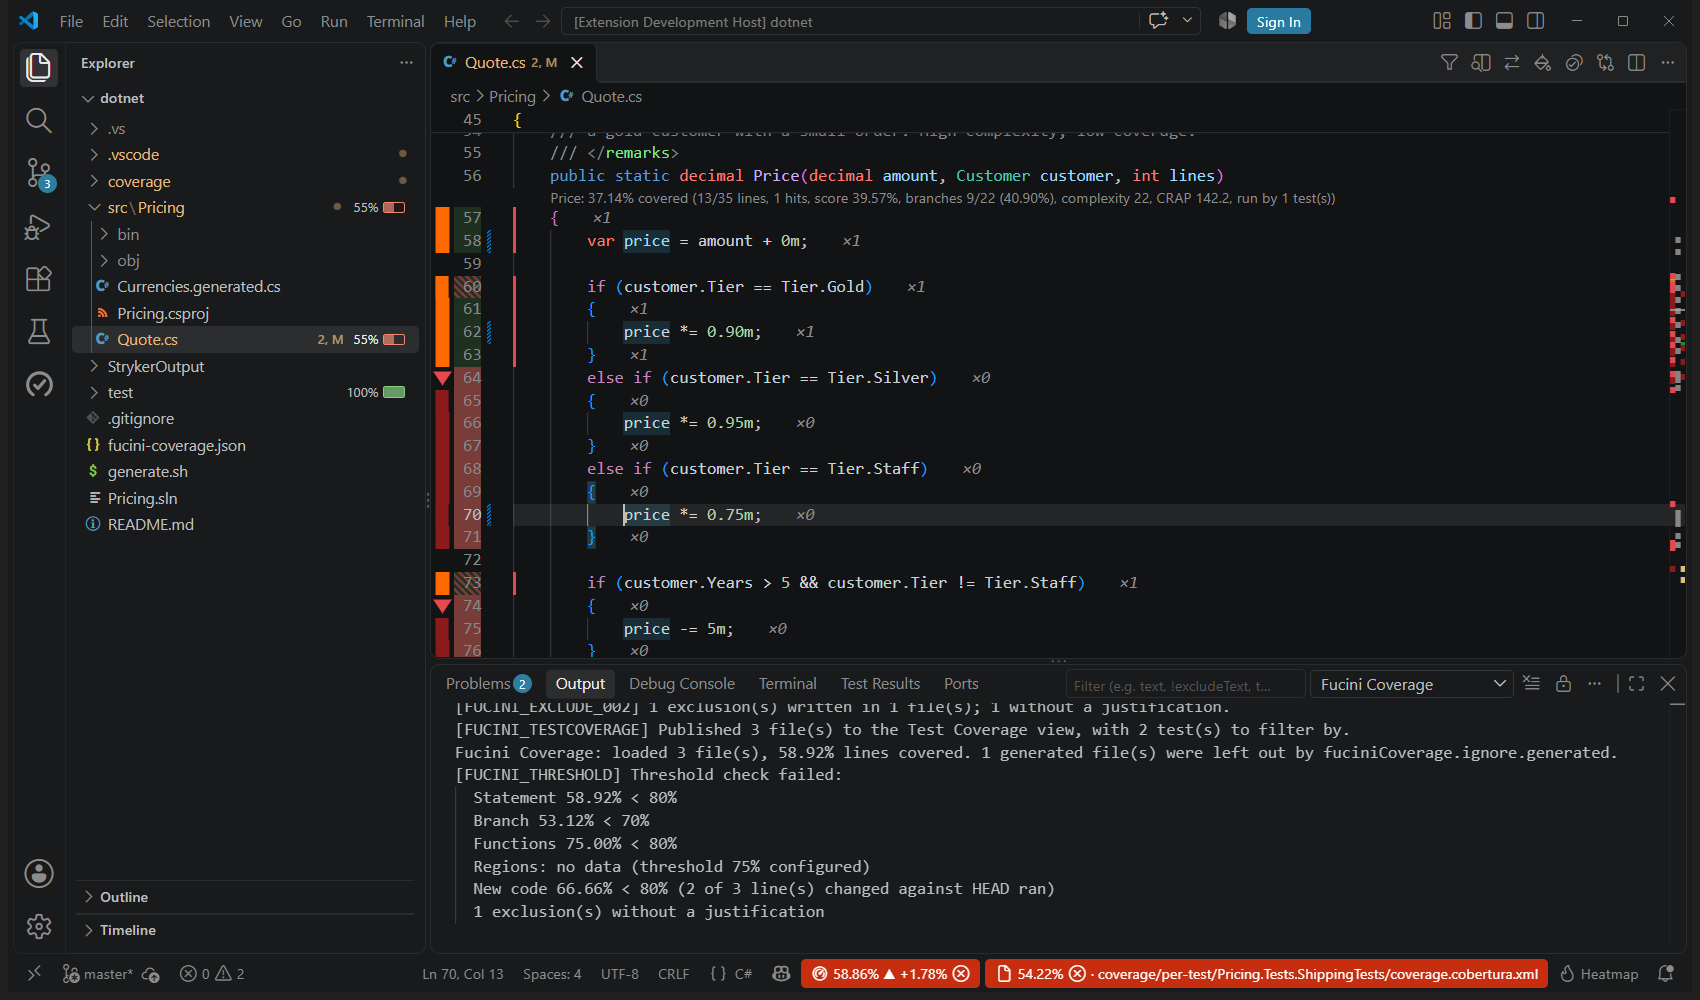 Screenshot pending — add assets/img/new-code-gate.png (see SCREENSHOTS.md).
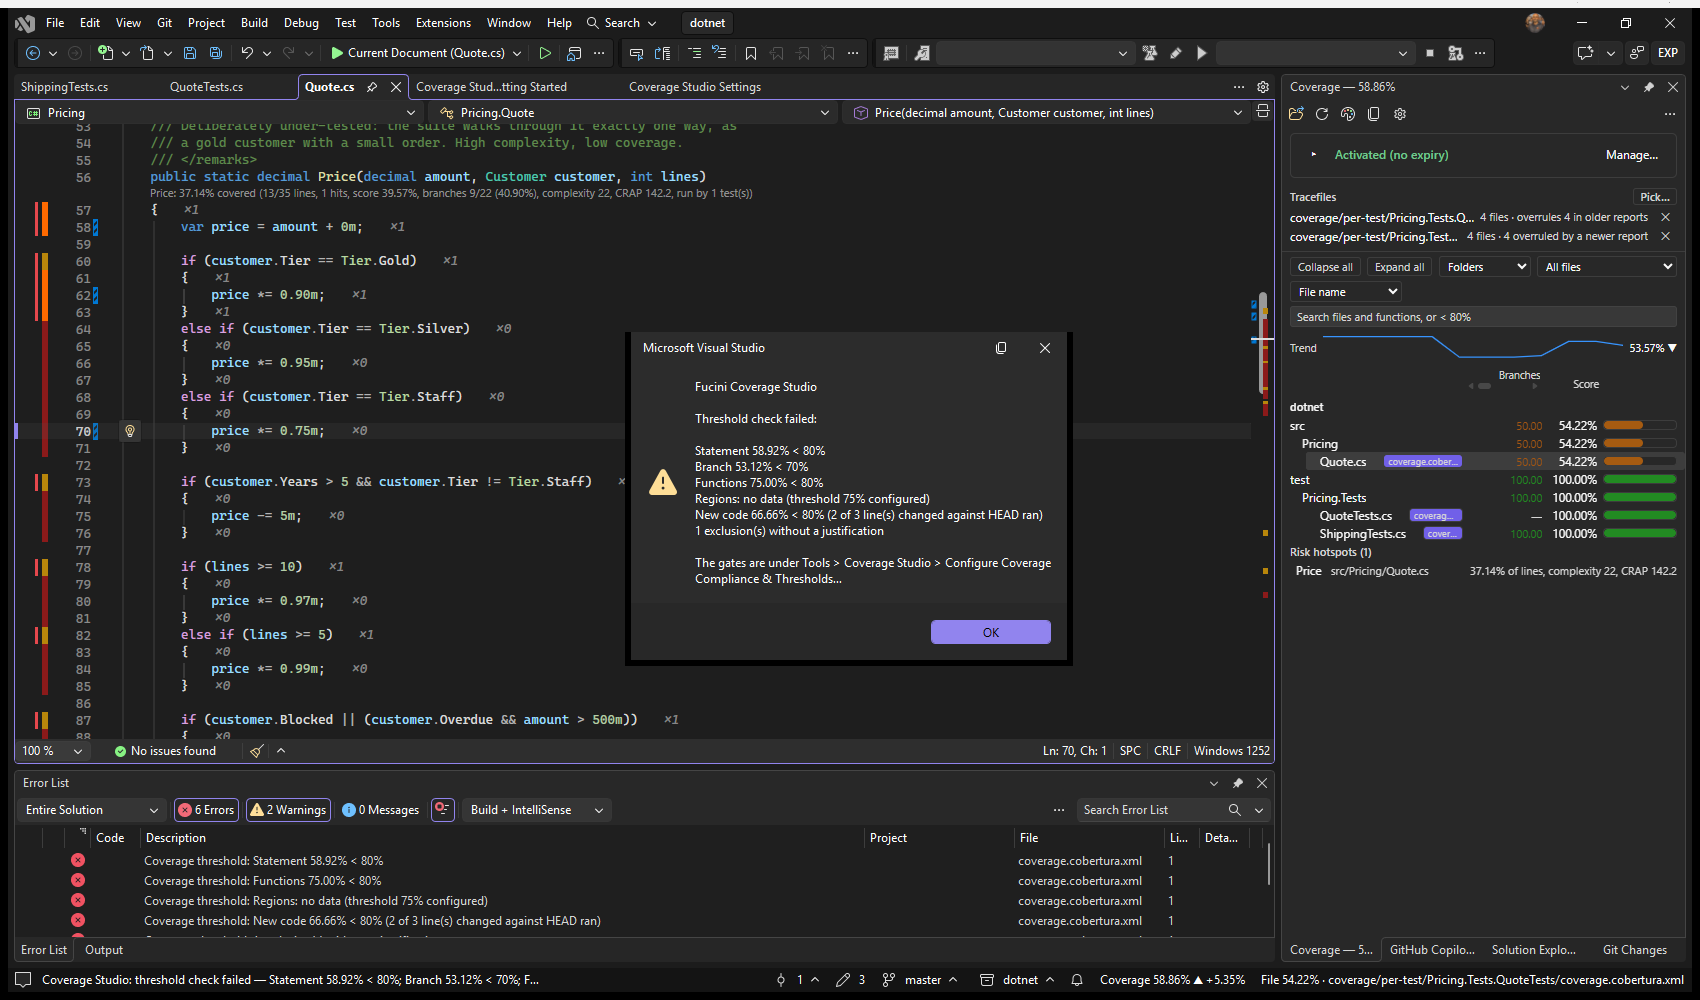 Screenshot pending — add assets/img/vs-new-code-gate.png (see SCREENSHOTS.md).
New code by tag, by author, by date
New code is by default the lines the working tree changes against gitDiff.baseRef — a branch, a commit, or a tag: "v1.4.0" is everything since that release. Two settings ask what a ref cannot. gitDiff.author takes part of an author's name, and new code is then the lines git gives to that author; gitDiff.since takes a day, and it is the lines last changed on that day or later, whatever branch they came in by; both together, that author's lines since that day. They are read off git blame, a file at a time — which a large run will feel at every load — and take the diff's place for diff coverage and for the gate above. A line not committed yet counts either way.
{
"fuciniCoverage.gitDiff.author": "Ada",
"fuciniCoverage.gitDiff.since": "2026-09-01"
}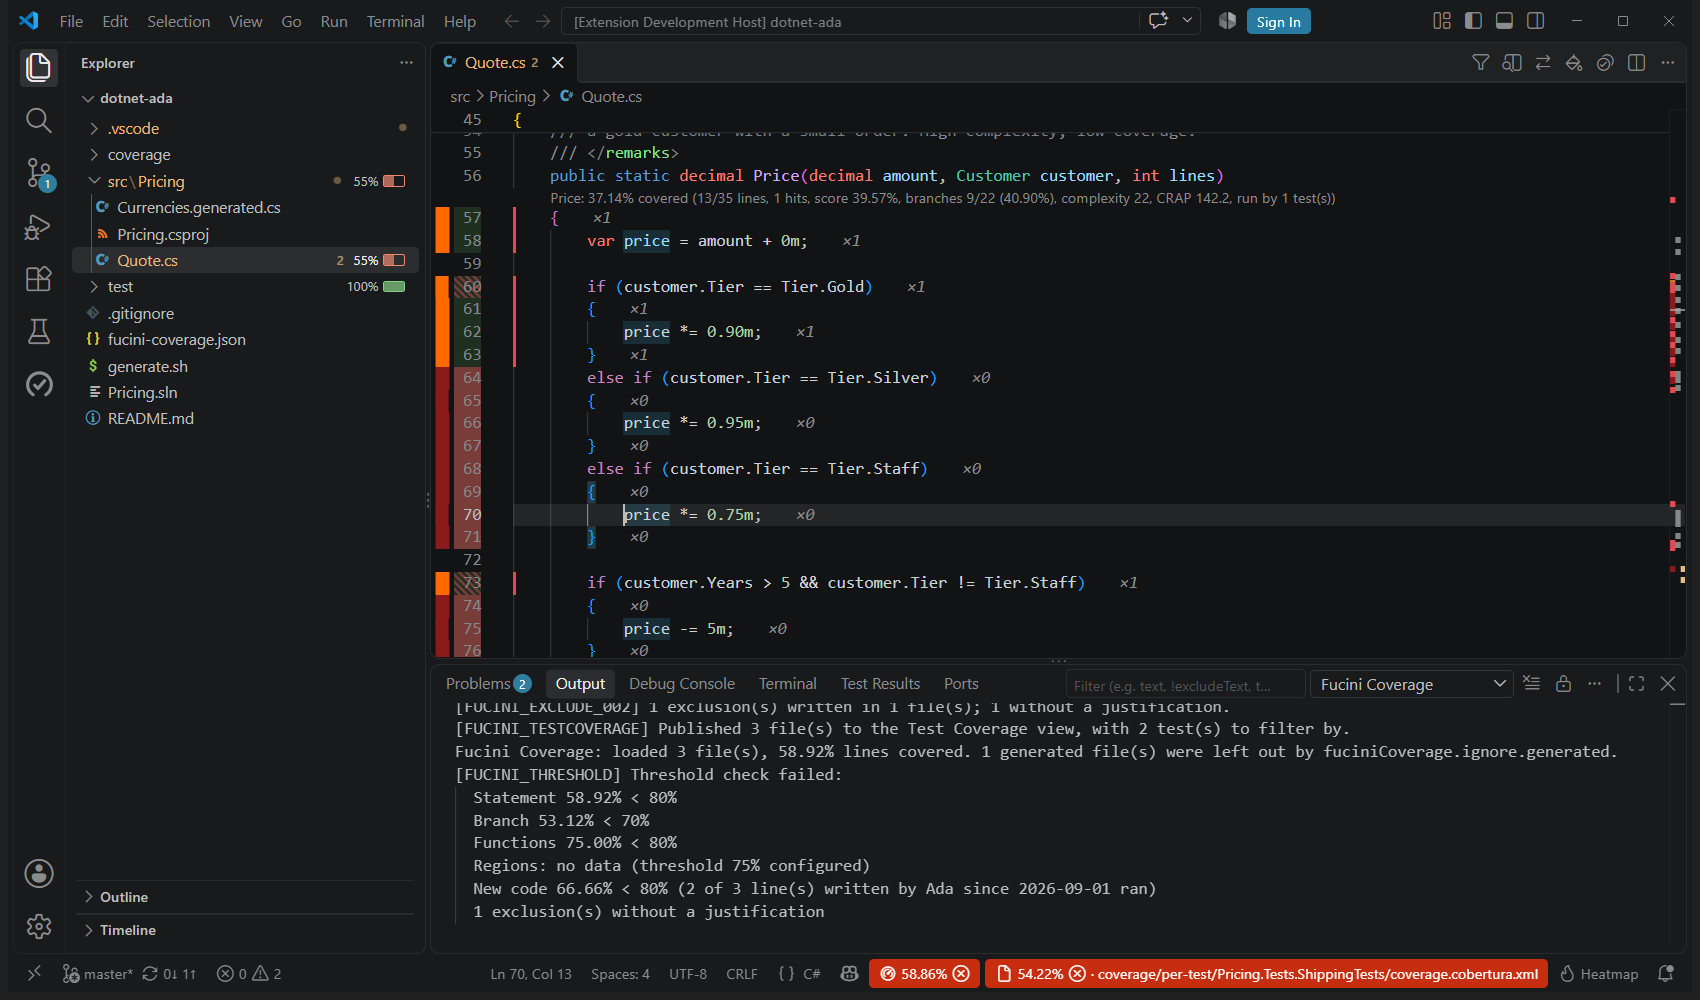 Screenshot pending — add assets/img/new-code-author.png (see SCREENSHOTS.md).
Indirect changes: what moved though nobody touched it
A diff says which lines changed; two runs say which lines stopped or started running. The lines worth a look are the ones where the two disagree: code nobody edited that no longer runs, because a test was deleted, a branch upstream returns early now, a fixture changed. A review of the diff cannot see them — they are outside it by definition. Show Indirect Coverage Changes… lists them per file, the file that lost most first, and opens the one you pick at its first such line. The run is held against the CI baseline where baseline.report names one — which is what a pull request is judged by — and against the run before it otherwise; the lines the working tree changes against gitDiff.baseRef, and everything below a place where that change moves the file's lines, are left out.
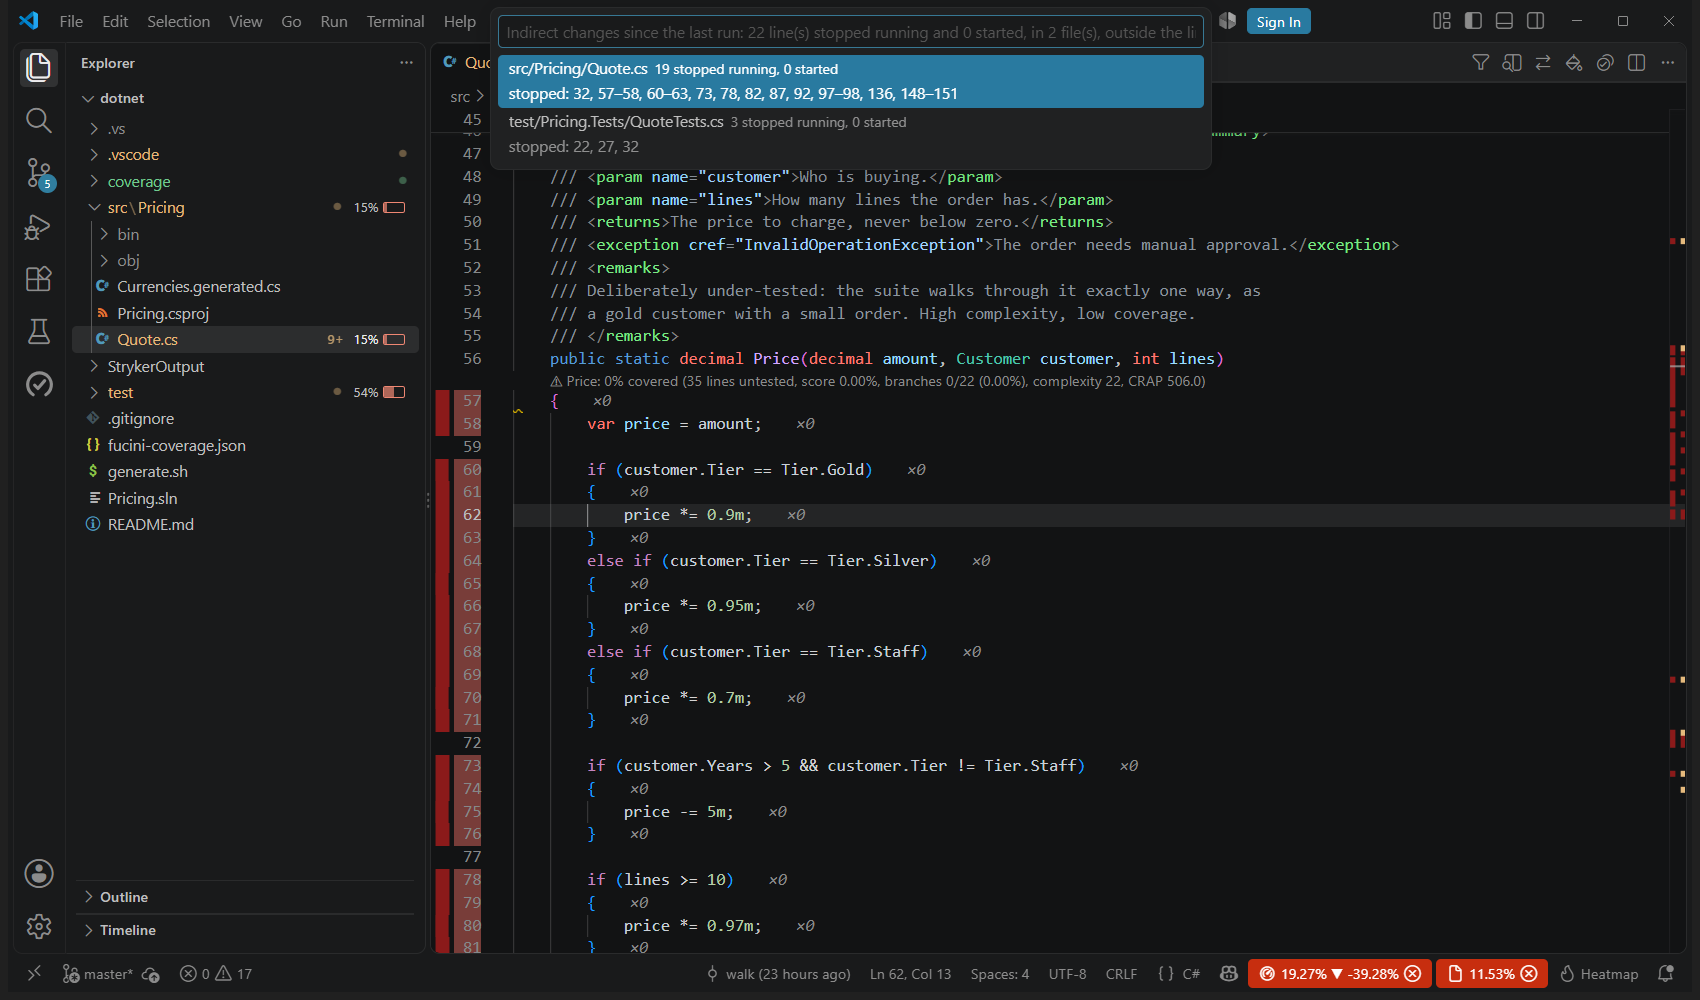 Screenshot pending — add assets/img/indirect-changes.png (see SCREENSHOTS.md).
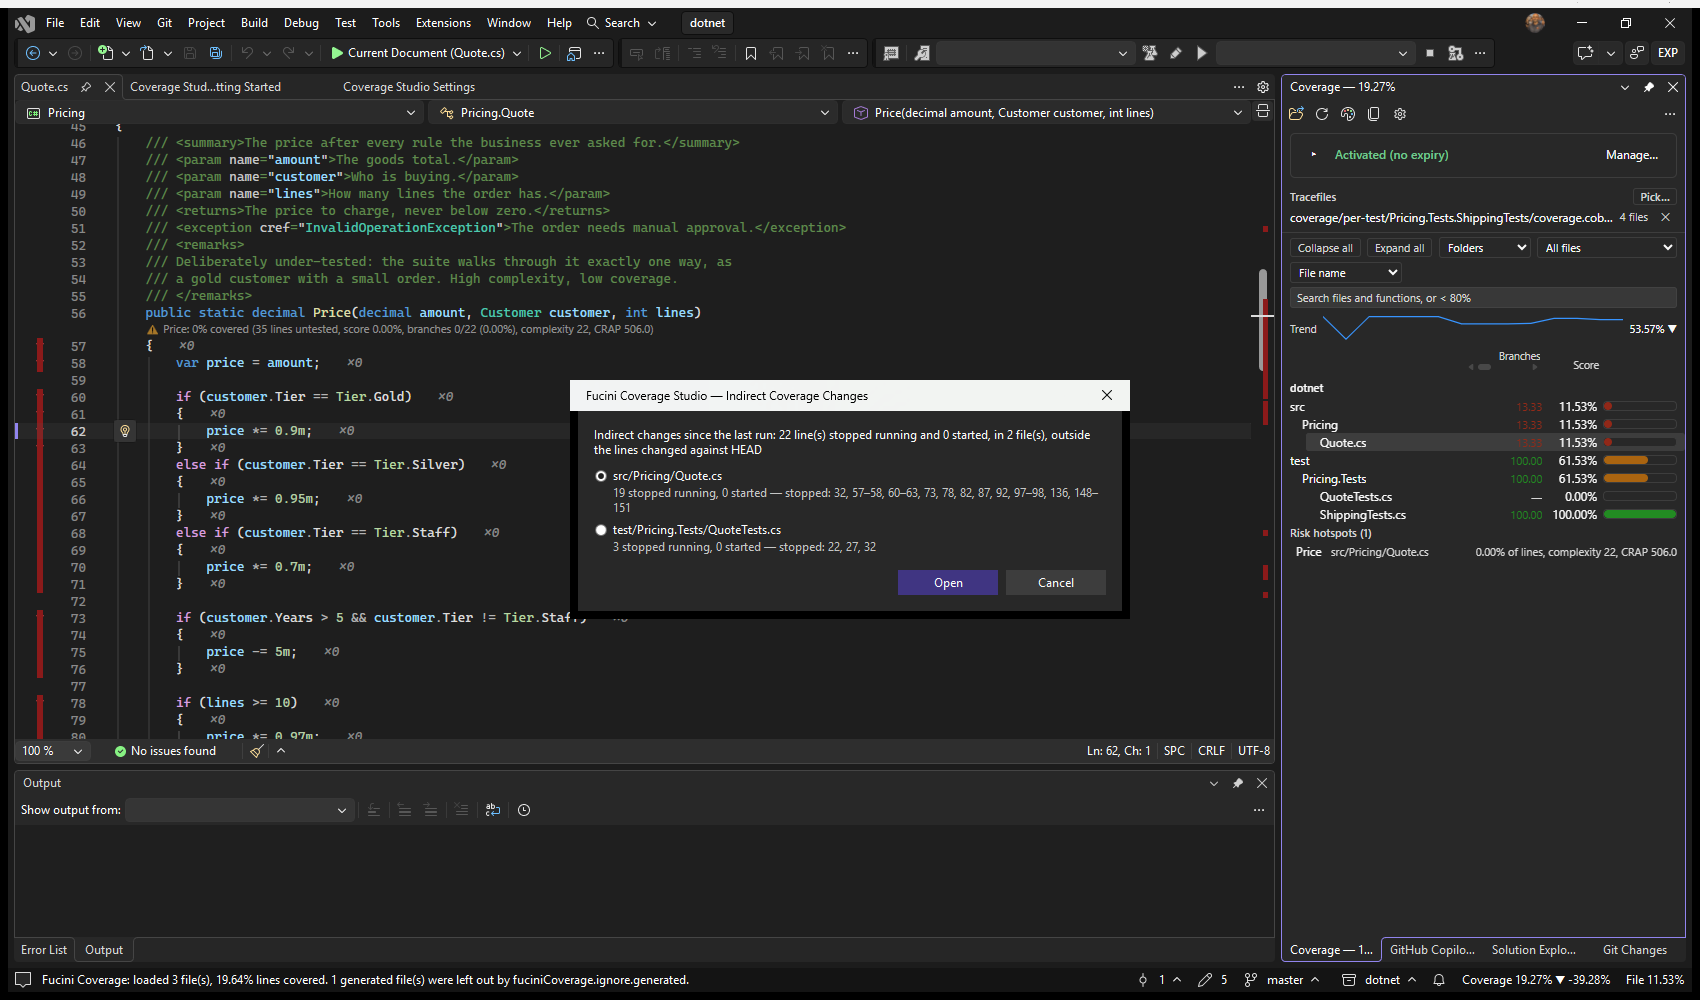 Screenshot pending — add assets/img/vs-indirect-changes.png (see SCREENSHOTS.md).
10. The composite score
Rather than reporting six numbers, the extension folds them into one Weighted Harmonic Mean (WHM). For metrics with percentages pᵢ and weights wᵢ:
WHM = ( Σ wᵢ ) / ( Σ wᵢ / pᵢ )A harmonic mean is dominated by its smallest term, so a weak metric cannot be masked by a perfect one — exactly the property you want from a safety gate. Default weights:
| Metric | Weight | Rationale |
|---|---|---|
| MC/DC | 4 | IEC 61508 SIL 3–4 / ISO 26262 ASIL C–D / DO-178C DAL A–B. |
| Branches | 2 | IEC 61508 SIL 2+ / ISO 26262 ASIL B+. |
| Conditions | 3 | Between branches and MC/DC (DO-178C, ISO 26262). |
| Regions | 1.5 | Sub-statement paths (e.g. partial short-circuit). |
| Lines | 1 | IEC 61508 SIL 1+ / ISO 26262 ASIL A+. |
| Functions | 1 | Dead-code gate. |
| Instantiations | 0.5 | C++ template coverage; narrowest scope. |
| Function calls | 1 | Call sites that were executed (gcov, VectorCAST, Testwell CTC++, TRACE32). |
| Object code | 0 | Off unless you give it a weight: it subsumes statement coverage. |
| Mutation score | 0 | Off unless you give it a weight: it is not coverage. |
Set any weight to 0 to drop that metric from the score. Metrics not present in the data (e.g. MC/DC in a plain lcov run) are simply omitted.
Object code and the mutation score weigh 0 until you decide otherwise (whmWeights.objectCode, whmWeights.mutation). Object-code coverage subsumes statement coverage, so weighing both counts the same evidence twice; a mutation score is not coverage at all — a suite can run every line and detect nothing. Both still have a column of their own and a threshold of their own.
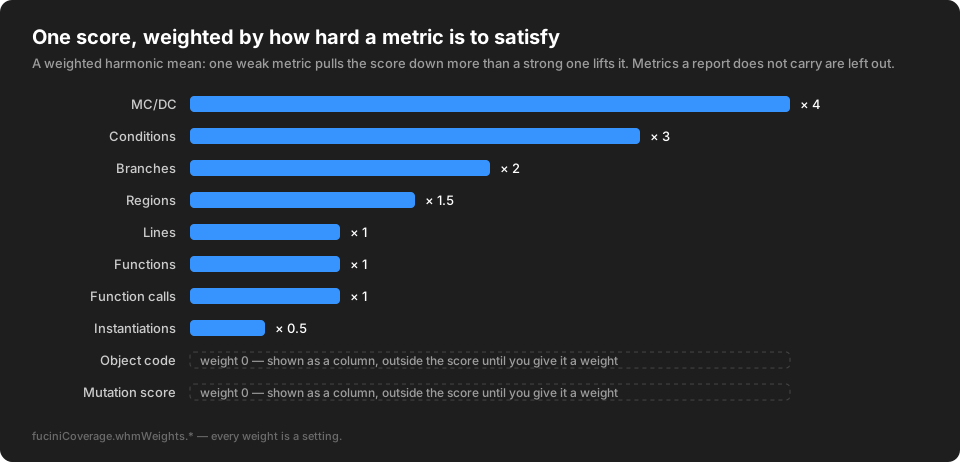 Screenshot pending — add assets/img/score-weights.svg (see SCREENSHOTS.md).
Condition coverage
a && b is one decision — two branches — and two conditions with four outcomes. A suite can take both branches and never see b false: branch coverage is complete and condition coverage is three of four. That level sits between branch coverage and MC/DC in DO-178C and ISO 26262, and since 0.2026.83 it is a metric of its own rather than folded into branches: a row in the status-bar cards, a column in the Coverage view, the reports and the exports, a weight of 3 in the score (whmWeights.conditions) and a gate (threshold.conditions; not gated under the standard profile, 100 under safety).
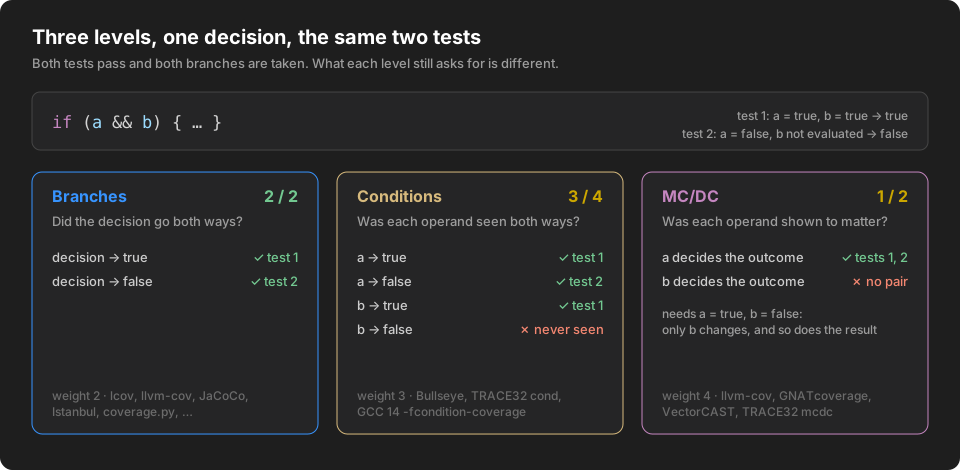 Screenshot pending — add assets/img/branch-condition-mcdc.svg (see SCREENSHOTS.md).
Read from BullseyeCoverage condition probes, a TRACE32 cond export and GCC 14 built with -fcondition-coverage. A report that does not tell conditions from decisions has no such row, column or weight. If you use Bullseye or TRACE32: conditions used to count as branches, so your branch percentage changes with this release, and with the new weight your composite score; set whmWeights.conditions to 0 for the score as it was.
GCC 14, line by line. -fcondition-coverage makes gcov say which outcome of which condition is missing — condition 1 never true, condition 0 never either way — and each condition is marked on its line and named in the hover, from gcov's JSON and from its text listing (condition outcomes covered 3/6). The metric is where the others are: threshold.conditions gates it and is left unjudged where a run has no such figure, Copy Coverage Summary has a Conditions column, badge.metric takes conditions, and the search box takes conditions < 80. A function's branch figure leaves its conditions' outcomes out, as the file's and the run's do.
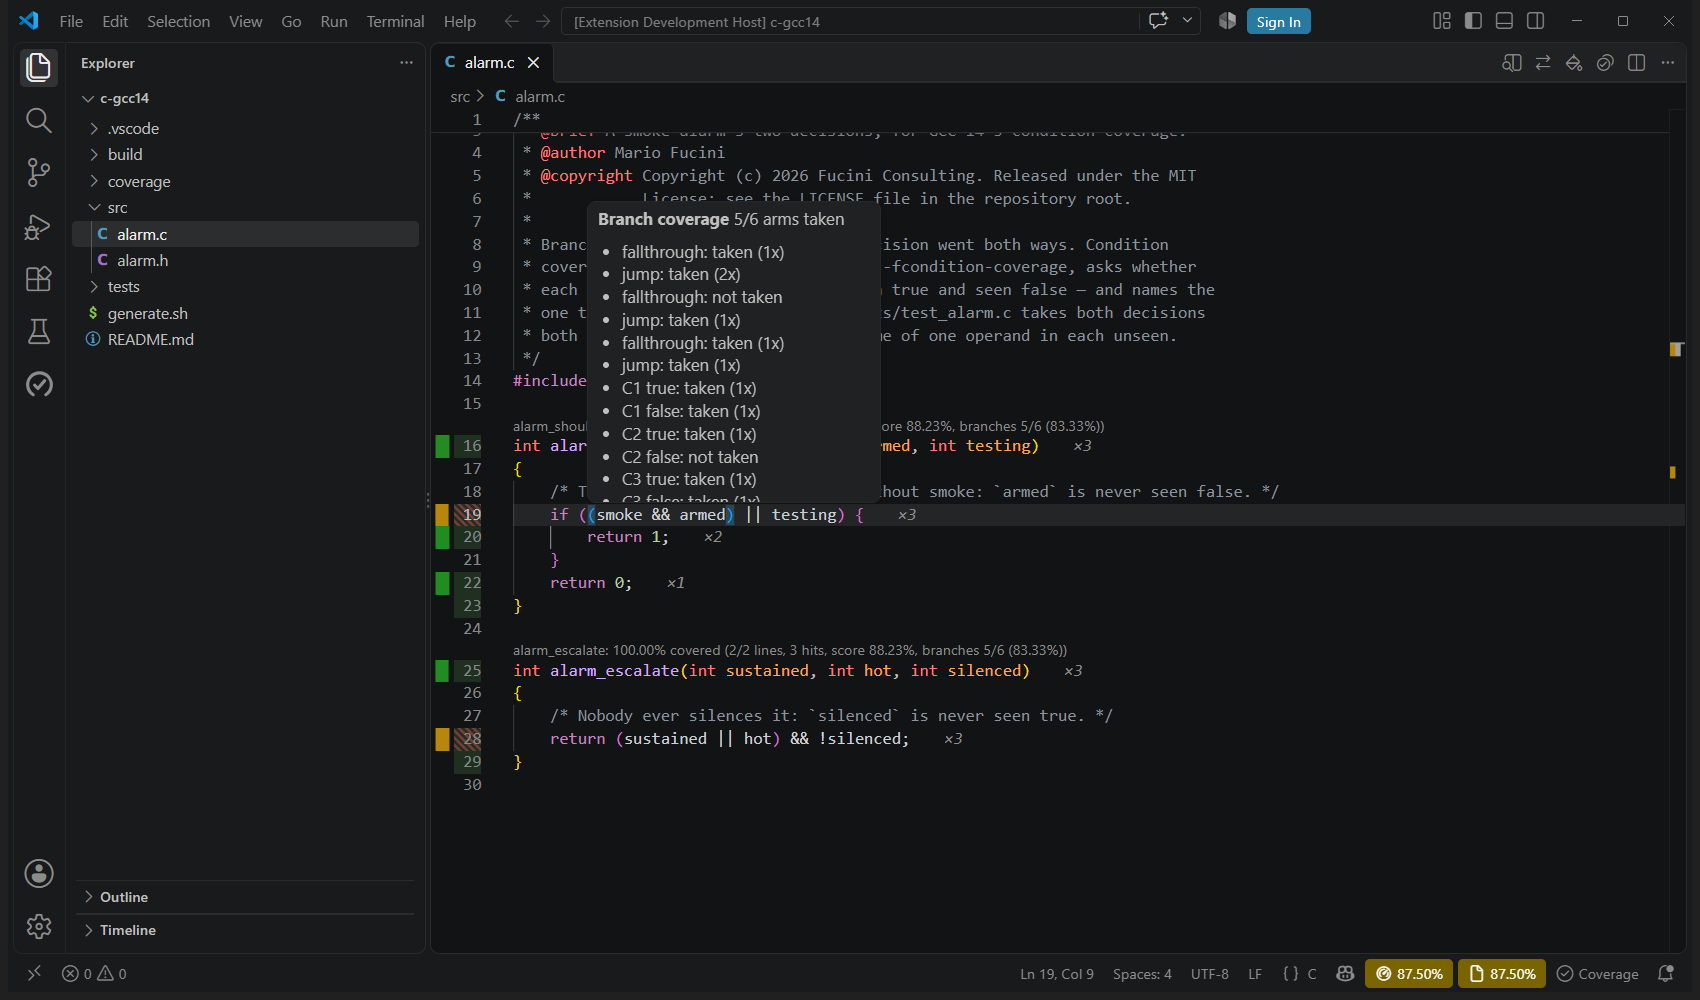 Screenshot pending — add assets/img/gcc-conditions.png (see SCREENSHOTS.md).
Complexity and CRAP
Some reports carry the cyclomatic complexity of every function: OpenCover (which is what Coverlet writes), JaCoCo, Clover and Cobertura. Where they do, the extension computes a CRAP score — Change Risk Anti-Patterns — for the function, from that complexity and from the coverage it measured itself:
CRAP = complexity² × (1 − coverage)³ + complexityA simple, fully tested function scores its own complexity and nothing more; a complex, barely tested one scores in the hundreds. In the C# sample of the demo project Price() has complexity 22 and about 37% of its lines covered, which makes 142.2, while Shipping() has complexity 12 and is fully covered, which makes 12. The customary line is 30: a function at or above it is listed under Riskiest Methods in the HTML report, worst first.
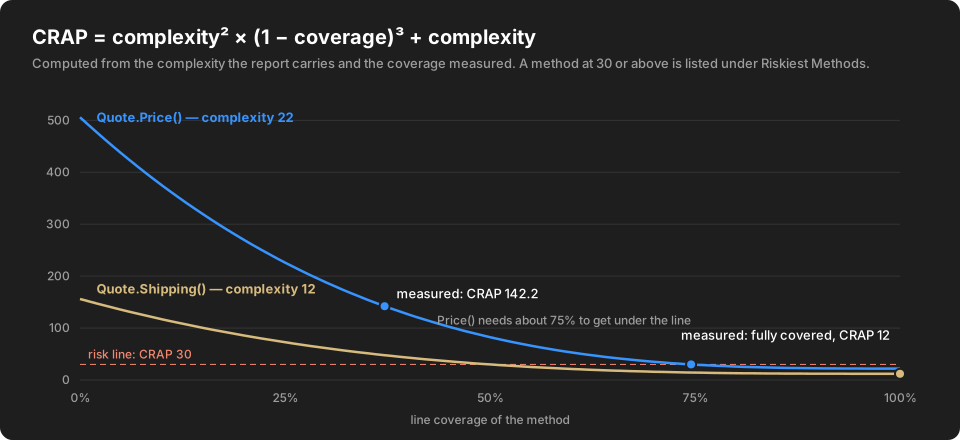 Screenshot pending — add assets/img/crap-curve.svg (see SCREENSHOTS.md).
The complexity and the score are on the function's CodeLens and next to the function in the annotated source. Max CRAP is the highest score of any function in a file — the worst one, not an average — and is a column in the Coverage view, the HTML report and the CSV and Markdown exports. It is information: it has no threshold and no weight in the composite score. Reports that carry no complexity (lcov, gcov, Istanbul, coverage.py) have no CRAP, and no empty column either.
Since 0.2026.83 C and C++ have it too. llvm-cov reports no complexity, so it is counted from the branch data the report already carries: the conditions written in the function's own file, plus one — McCabe's definition, and what the source-level tools count for .NET and Java. Conditions that came out of a macro from another file, every assert for one, are not counted.
 Screenshot pending — add assets/img/riskiest-methods.png (see SCREENSHOTS.md).
Risk hotspots, and which files to show
Under the tree of the Coverage view, Risk hotspots lists the functions where complex code meets little coverage, worst first, each opening its file at the function. A function qualifies by CRAP score — hotspots.crapThreshold, 30 by default, the figure the metric's authors proposed — or by cyclomatic complexity alone, hotspots.complexityThreshold, off by default; only reports that carry complexity (OpenCover, Cobertura from Coverlet, JaCoCo, llvm-cov) have any. Community sees the count and the worst score; the ranked list is Pro. Beside the sort, a second dropdown says which files the tree shows — all, files with gaps, untested files, or the files changed since the last run; folders follow their files and keep their own numbers. Both are in Visual Studio too, in the Coverage window.
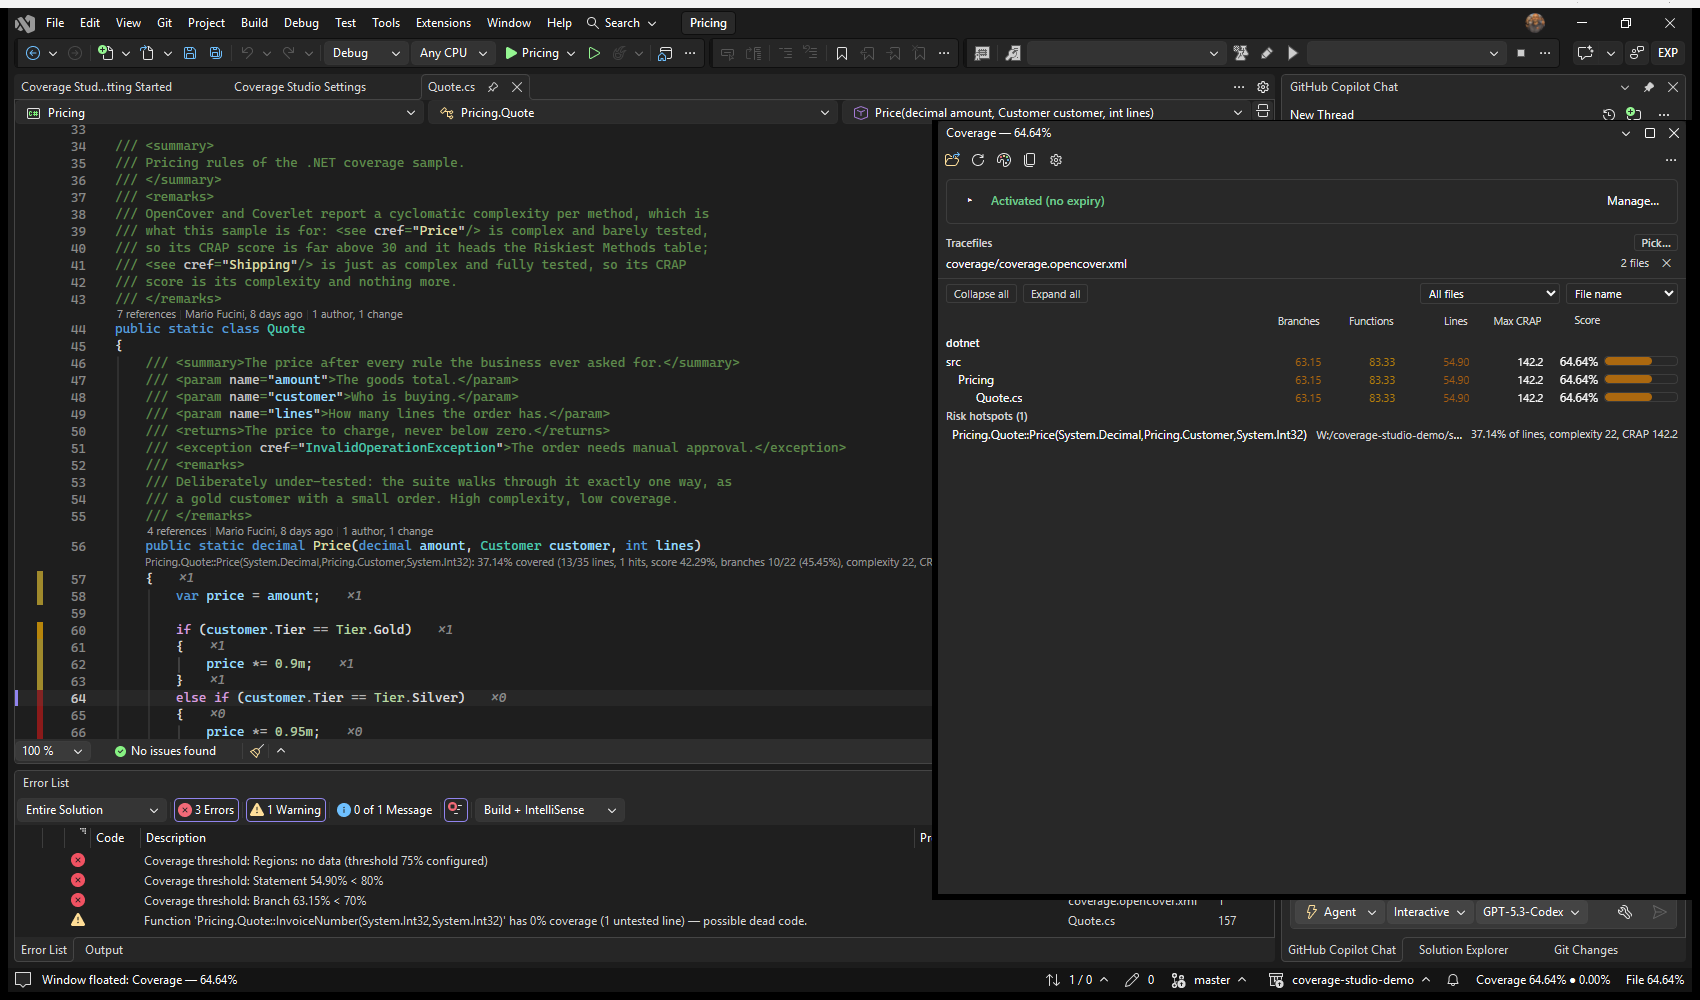 Screenshot pending — add assets/img/vs-hotspots.png (see SCREENSHOTS.md).
Namespaces, classes and methods
For a .NET report that names its classes — Cobertura and Coverlet's coverage.cobertura.xml, OpenCover — a third dropdown, Folders / Namespaces, draws the same run as namespaces, classes and methods: a namespace's number is its classes' added up, a class's its methods', exactly as a folder's is its files', with the same sort and the same filter. A method row opens the file at the method; a class declared in no namespace is under (no namespace). The choice is written to coverageView.perspective; a run that carries no class names has no dropdown and shows its folders. In Visual Studio the Coverage window has the same dropdown.
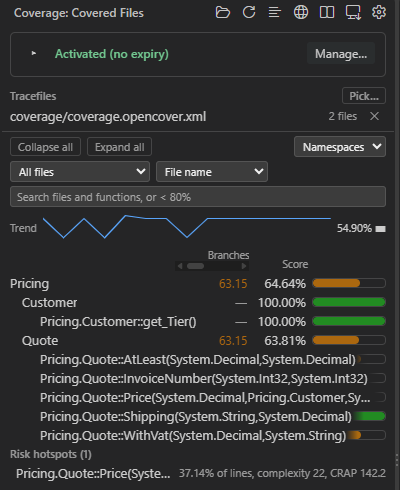 Screenshot pending — add assets/img/namespace-perspective.png (see SCREENSHOTS.md).
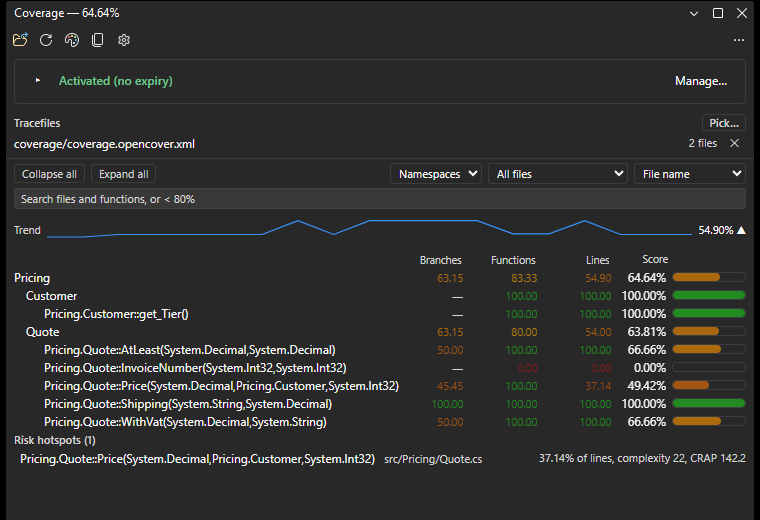
Searching the tree
Under the buttons and dropdowns, a search box. A word keeps the rows whose name or path carries it — every word typed has to be there; a comparison keeps the rows whose figure passes it — < 80% on the score, lines >= 90, branches = 0, functions != 100, mcdc < 50 — and invoice < 80 wants both. Method rows of the namespace perspective and the risk hotspots are searched with the files, so a function is found where the run has it. The tree is filtered as you type, in the page, without a redraw; a folder holding a match opens for it and closes again when the box empties; Esc clears it. The same box, the same grammar, in Visual Studio.
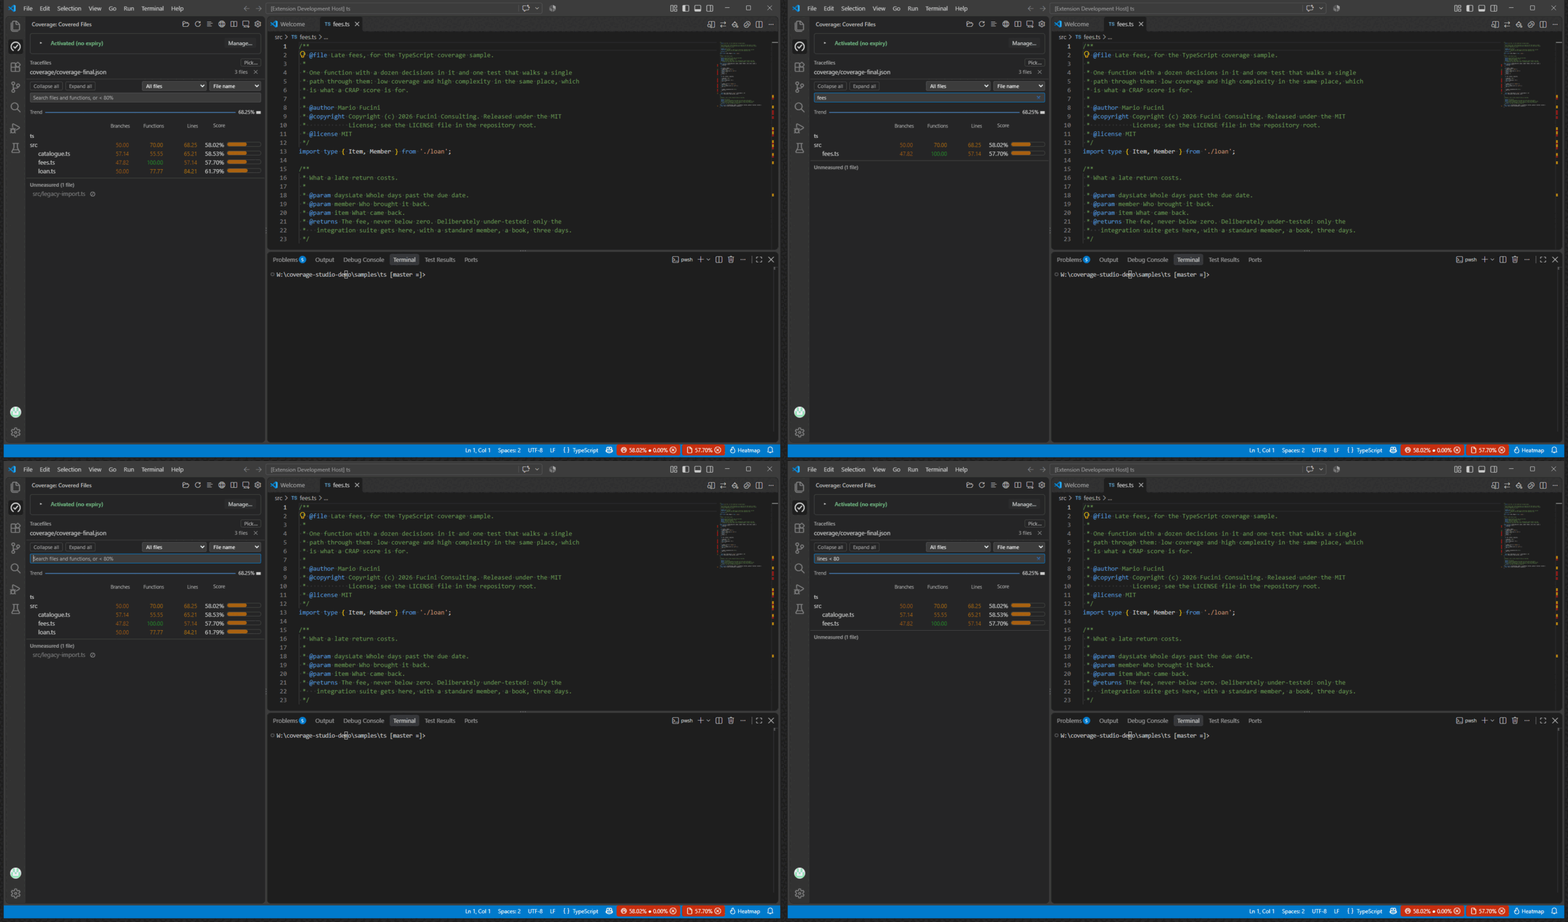 Screenshot pending — add assets/img/tree-search.gif (see SCREENSHOTS.md).
lines < 80.The tree follows the editor
The file you are looking at is highlighted in the Coverage view, the folders above it are opened and its row is scrolled into view — the tree no longer has to be searched for the file that is already open. The tree keeps its scroll position otherwise, and nothing is redrawn. coverageView.followActiveEditor, on by default, turns it off for those who would rather leave the tree where they put it.
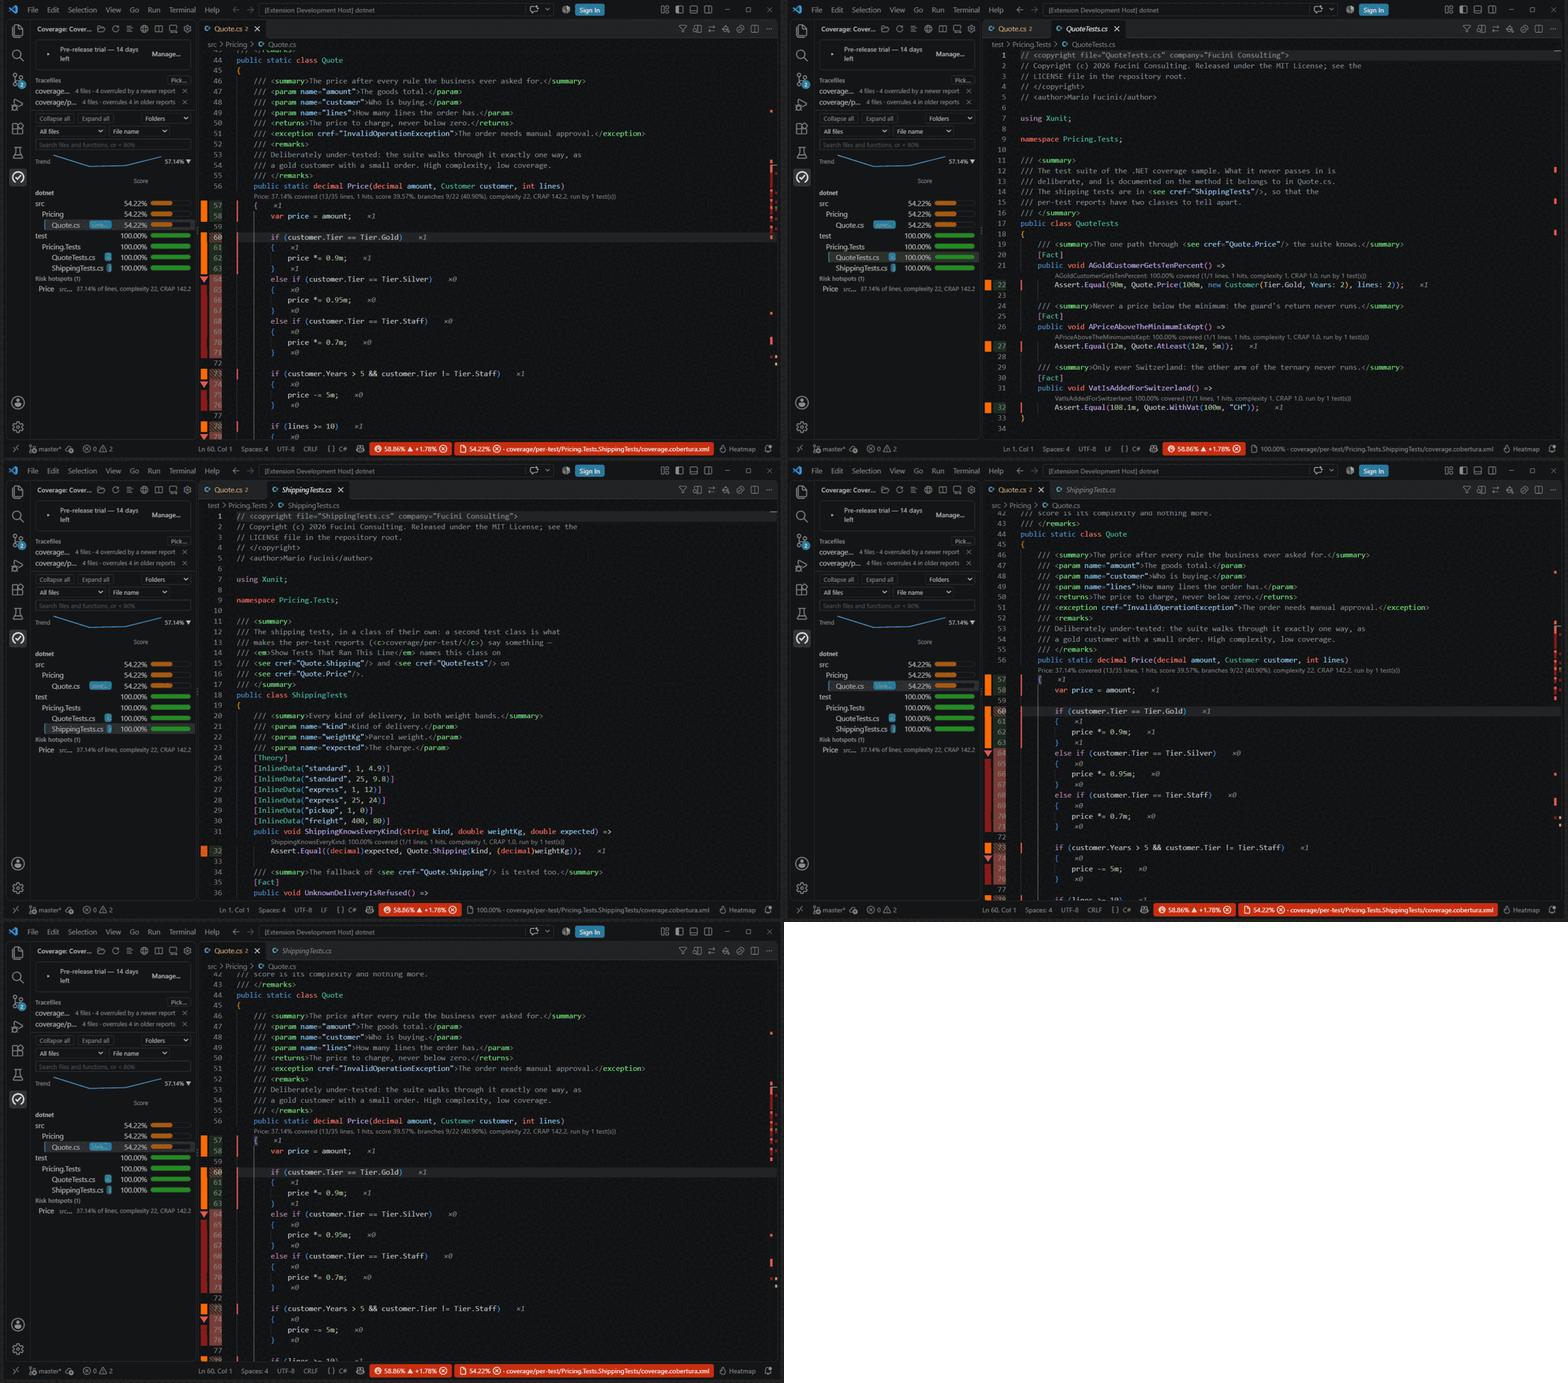 Screenshot pending — add assets/img/follow-editor.gif (see SCREENSHOTS.md).
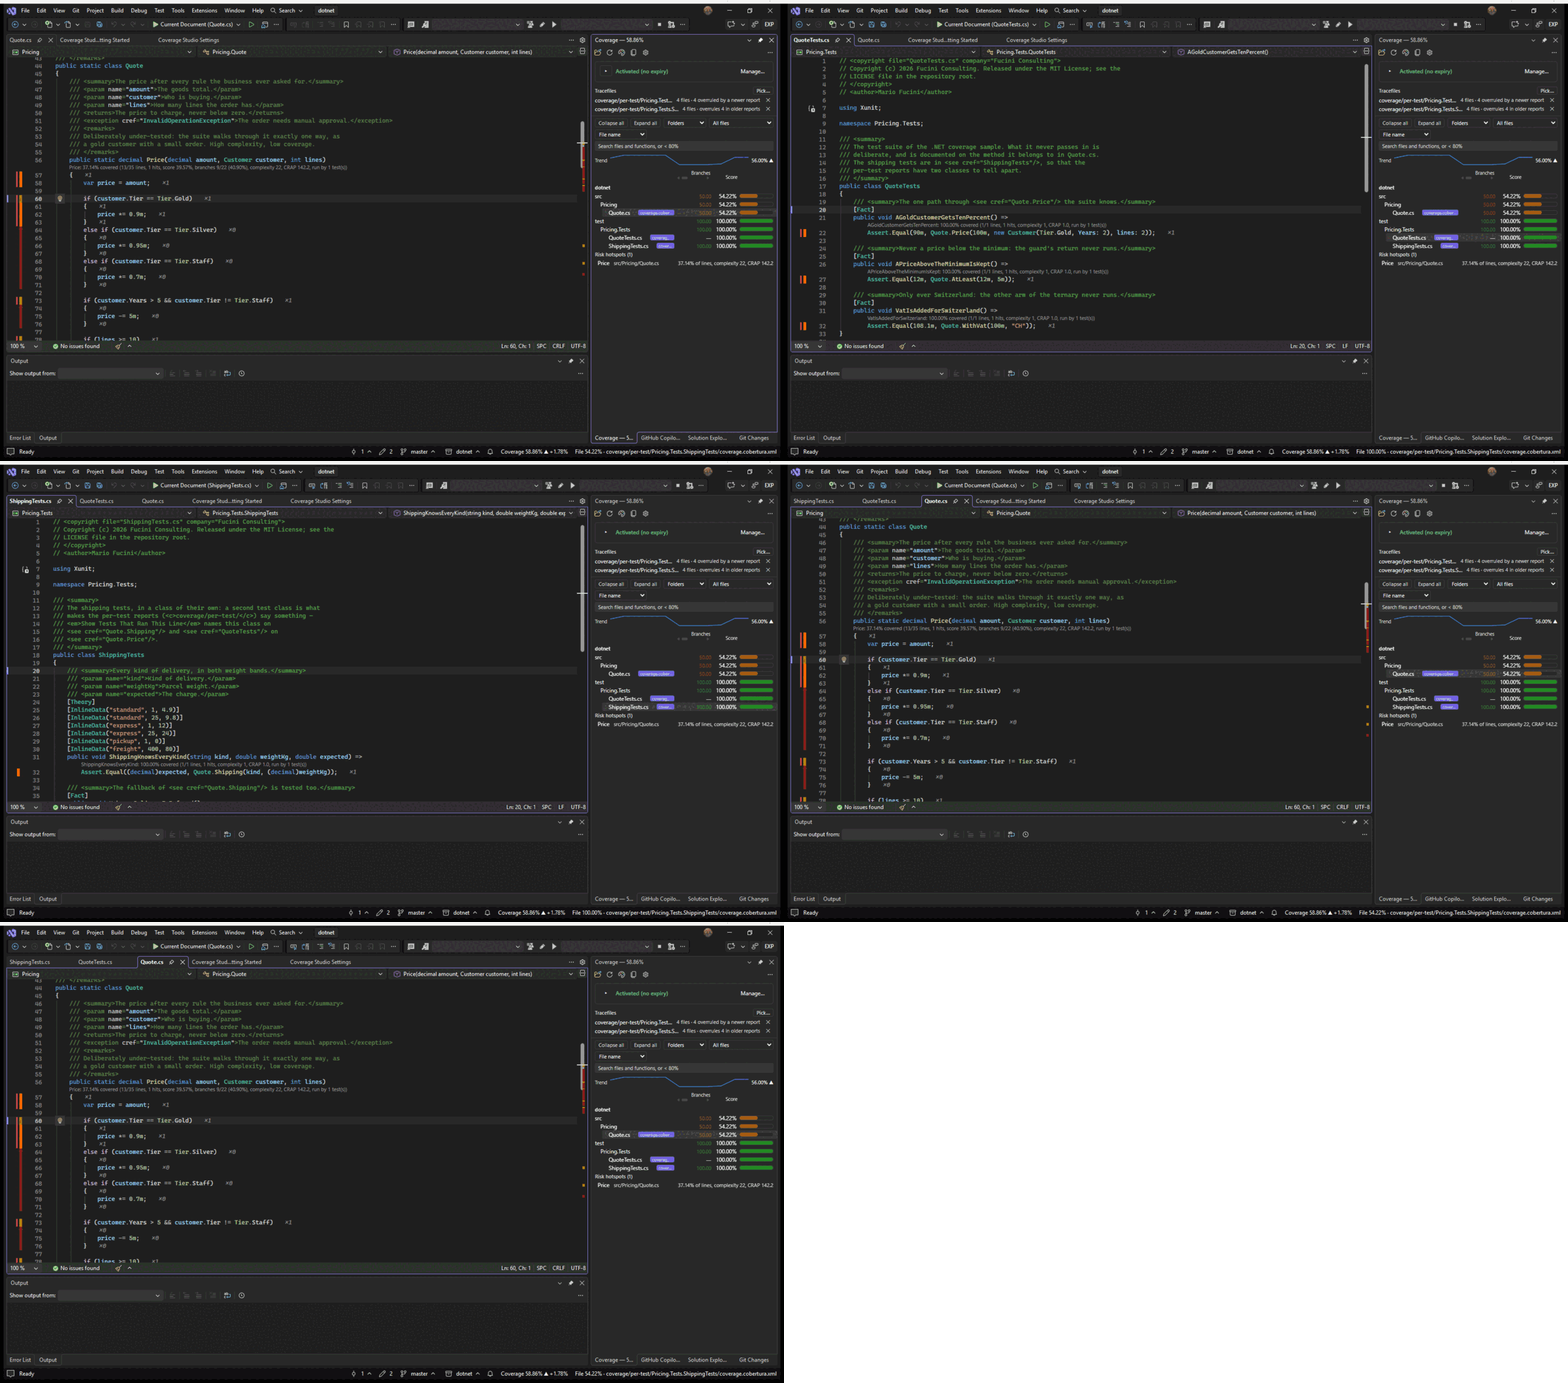 Screenshot pending — add assets/img/vs-follow-editor.gif (see SCREENSHOTS.md).
11. Compliance gating
The COMPLIANT / NON-COMPLIANT verdict (shown in the annotated-source view, the HTML report and both status-bar hovers) is driven by per-metric thresholds and a mode:
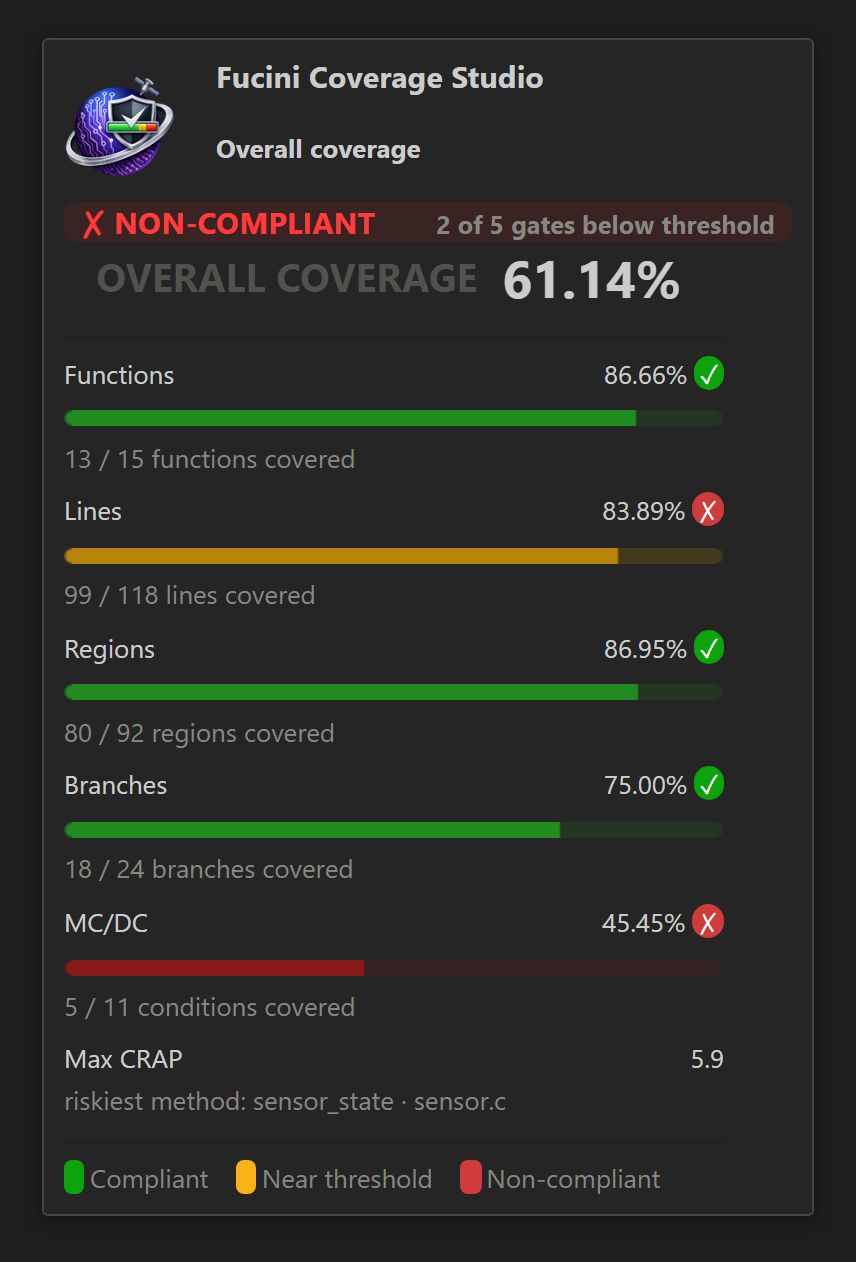 Screenshot pending — add assets/img/statusbar.png (see SCREENSHOTS.md).
| Mode | COMPLIANT when… |
|---|---|
strict (default) | every individually-gated metric meets its own threshold — no trade-offs. |
whm | the single weighted composite score meets threshold.weighted. |
both | the weighted gate AND the strict per-metric gate are met. |
either | the weighted gate OR the strict per-metric gate is met (loosest). |
A threshold of 0 switches that gate off, and a metric the report does not carry is never judged. What a threshold you have not set stands for is decided by the profile below. Run Fucini Coverage: Check Coverage Thresholds to evaluate on demand.
In Visual Studio. Tools → Coverage Studio → Check Coverage Thresholds judges the run against the same threshold.* keys and says so in the status bar and the Output pane; with compliance.diagnostics, problems.enabled, problems.perLine or deadCode.enabled the findings sit in the Error List beside the compiler's own — one entry per file below a gate, one per uncovered range, one per function that never ran — each opening its file at the line.
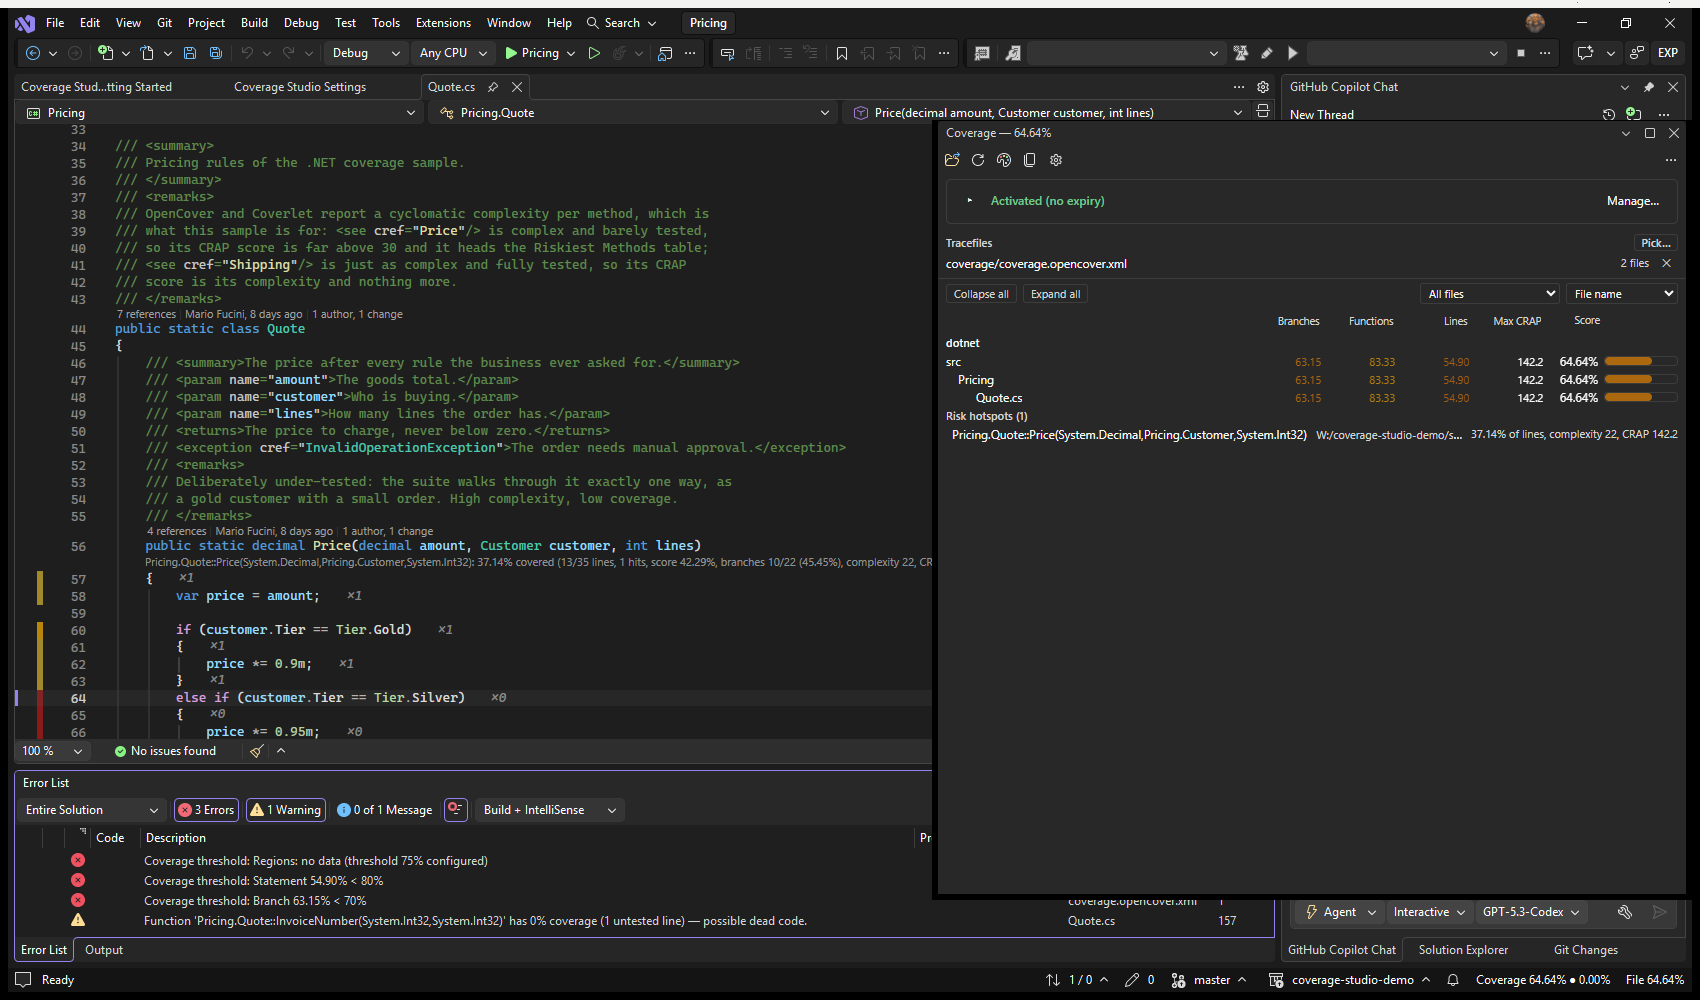 Screenshot pending — add assets/img/vs-error-list.png (see SCREENSHOTS.md).
Threshold profiles
threshold.profile decides what a threshold you have not set stands for. standard, the default since 0.2026.82, is what an ordinary project that is not safety related can be held to. safety is every gate at 100 — what a safety case asks for, and exactly what shipped up to 0.2026.81.
| Metric | standard | safety |
|---|---|---|
| Lines | 80 | 100 |
| Functions | 80 | 100 |
| Regions | 75 | 100 |
| Branches | 70 | 100 |
| Composite score | 75 | 100 |
| MC/DC, instantiations, function calls, object code | not gated | 100 |
| Conditions | not gated | 100 |
| Mutation score | not gated | not gated |
A threshold you did set wins over either profile. The example gates branches at 90 and everything else at 100; to hold only some metrics to 100, stay on standard and set those yourself. One caveat follows from how settings work: a value equal to the shipped default cannot be told from no value at all, so under safety a threshold written as exactly its standard figure — 80 for lines, say — still counts as 100.
{
"fuciniCoverage.threshold.profile": "safety",
"fuciniCoverage.threshold.branch": 90
}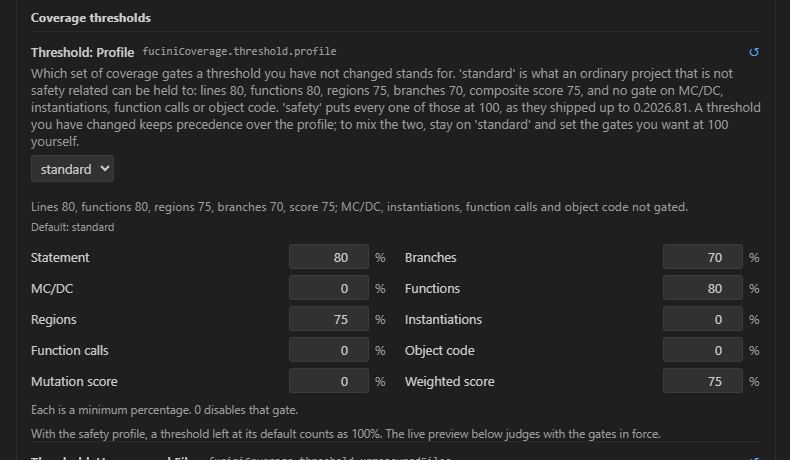 Screenshot pending — add assets/img/threshold-profile.png (see SCREENSHOTS.md).
 Screenshot pending — add assets/img/threshold-profiles.gif (see SCREENSHOTS.md).
If you relied on the old defaults, you are judged more leniently after updating to 0.2026.82 until you select safety. An install that ran before is told so once, with a Keep 100% (safety) button that writes the profile into your user settings; for a shared project put it in the workspace settings as well, so that everybody is judged alike. Configure Coverage Compliance & Thresholds... has the profile above the threshold grid, and its live preview judges with the gates actually in force. In every card and report, a metric whose gate is off shows its figure with a neutral dash instead of a tick or a cross.
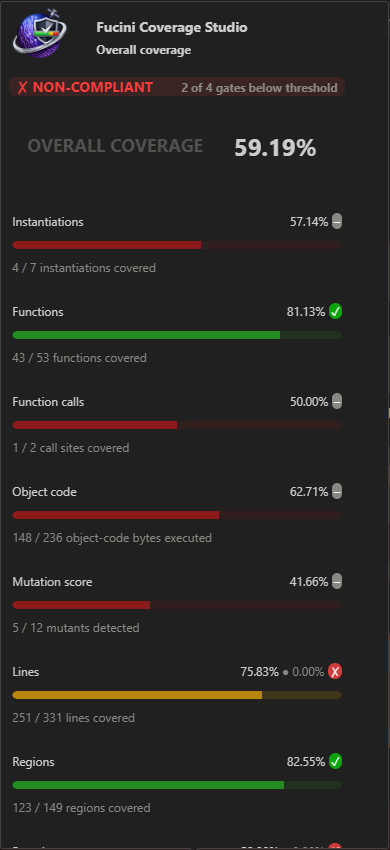 Screenshot pending — add assets/img/statusbar-metrics.png (see SCREENSHOTS.md).
11a. Object-code coverage
Every other metric here is measured from source: a tool instruments your code, the instrumented build runs, and the counters say which statements, branches or conditions were exercised. Object-code coverage measures something else — how much of the built binary actually executed, counted in instruction bytes, by watching the instruction stream rather than by instrumenting the source. That matters because a compiler emits code no line of your source accounts for: array-bounds checks, switch jump tables, register spills, stack probes, calls into runtime helpers for division or floating point on cores without the instruction. It is also the only metric here that answers does this cover assembly? — hand-written assembly is never instrumented and a source-based tool cannot reach it. DO-178C is explicit about why: at level A, where a compiler or linker generates code that is not directly traceable to source statements, objective 6.4.4.2b requires additional verification of exactly that generated code.
It subsumes statement coverage — every executed instruction came from a statement, so 100% object coverage implies 100% statement coverage. The converse does not hold, and that asymmetry is the whole point of measuring it. Two things follow. It takes no weight in the composite score, because averaging two measures of the same executions counts the same evidence twice; it is gated instead through fuciniCoverage.threshold.objectCode — a requirement rather than a weight, which is how the standard asks for it. And the gap is the deliverable: a run at 100% line coverage with less than 100% object coverage has located exactly the compiler-generated code your source does not account for, so the compliance card says 312 bytes never executed, with 100% line coverage rather than burying it as 94%. The reverse — a whole binary reported as run while its source was not — is a contradiction rather than a low score, nearly always a stale tracefile on one side of a merge or module names that never matched file paths, and it is reported as a finding.
Object-code coverage needs the binary to run somewhere its instructions can be observed. There are three routes and they differ enormously in cost. Only the third produces object-code coverage; the first two are here because they solve a related problem that is often the one actually worth solving.
- An instrumented build, running on the target. GCC cross-compilers accept
-fprofile-arcs -ftest-coverage, so the instrumentation that works on a workstation works on the target — except that a bare-metal system has no filesystem to write.gcdacounters to, and often noexit()to write them at. The counters live in RAM regardless, so the fix is to dump that memory and rebuild the files off-target; NASA JPL'sembedded-gcov(Apache-2.0) does exactly that, without a filesystem, an operating system or a standard C library. This gives statement, branch and function coverage of a build made by your cross-compiler, for your instruction set, on your hardware — not object-code coverage, and the binary measured is instrumented, so larger and slower than the one you ship. Load the result as LCOV, gcovr JSON, gcov JSON, or, on a toolchain older than GCC 9, the plain-text.gcovlisting. - An instruction-set simulator. Run the real target binary in a simulator and derive coverage from the addresses it executed: no hardware, no instrumentation, no probe, and because it observes instructions it can produce genuine object-code coverage. The limit is fidelity — a simulator models the core well and the peripherals less well, so treat whole-system results with suspicion unless it models your silicon closely.
- On-chip trace and a debugger. The certification-grade route, and the only genuinely non-intrusive one: the core's trace unit reports the instruction stream to a debugger, which turns it into coverage. Nothing is instrumented, code size does not change and timing is unaffected — which is what makes the result evidence about the binary you actually ship. Check the silicon before budgeting for it: on many microcontroller families full trace is available only on an emulation or development variant with a large trace buffer and a high-speed trace port, while production parts expose a reduced trace unit whose vendor fallback is a software trace that instruments the code and costs CPU time — removing the very property the route was chosen for.
Many embedded projects measure coverage by compiling the same sources for the development machine and running the unit tests there. It is fast, it needs no hardware, and it is the right default for most teams — but it is worth being clear about what that evidence describes: a different compiler, a different optimiser, a different instruction set and a different binary from the one that ships. For most software that is an acceptable and well-understood trade-off. For work assessed against IEC 61508, ISO 26262 or DO-178C it is the standard host-versus-target objection, and the routes above are the standard answers to it — the first closes it for source coverage, the third for object code.
Today the export read for object code is Lauterbach TRACE32's COVerage.EXPORT.ListModule with metric="object"; load it as you would any other tracefile. The metric is scored and gated on a paid licence and during the evaluation period. A Community install does not score it, but it is told when a tracefile carries it — a compliance verdict that silently omitted the strongest evidence in the file would be worse than one that says what it left out.
12. Excluding non-code lines
With excludeComments on (the default), statements that fall entirely on comment-only or blank lines are excluded from totals — this also neutralises a known llvm-cov/gcov quirk where a stray hit count lands on a comment. Standard markers are honoured too:
x = risky();          // LCOV_EXCL_LINE
// LCOV_EXCL_START
debug_only_block();
// LCOV_EXCL_STOP
Preprocessor directives count as no code either, in C, C++, Objective-C, CUDA and C#: a line starting with # — #define, #include, #if — and the lines a trailing backslash continues it onto. gcov charges each use of a macro to the line it is defined on, so a header whose only reported line was #define CHANNEL_COUNT (33U) read as 100% covered because a loop in the .c file ran up to it, and one whose constant nothing used read as 0%. Such a header now has nothing to measure and is not listed.
Set excluded.includeInTotals to true to count excluded lines anyway.
Leaving a file or a folder out, from the tree
Right-click a file or a folder in the Coverage view and choose Exclude from Coverage — it is among the row's path actions too — or run Exclude This File from Coverage on the open file: the file's workspace-relative path, or the folder's /**, goes into fuciniCoverage.ignore in the folder's settings, once, and the reload takes it out of every total and every page; the pattern is there to be taken out again. In Visual Studio the row's menu and Tools → Coverage Studio have the same two, writing the same setting into the same file.
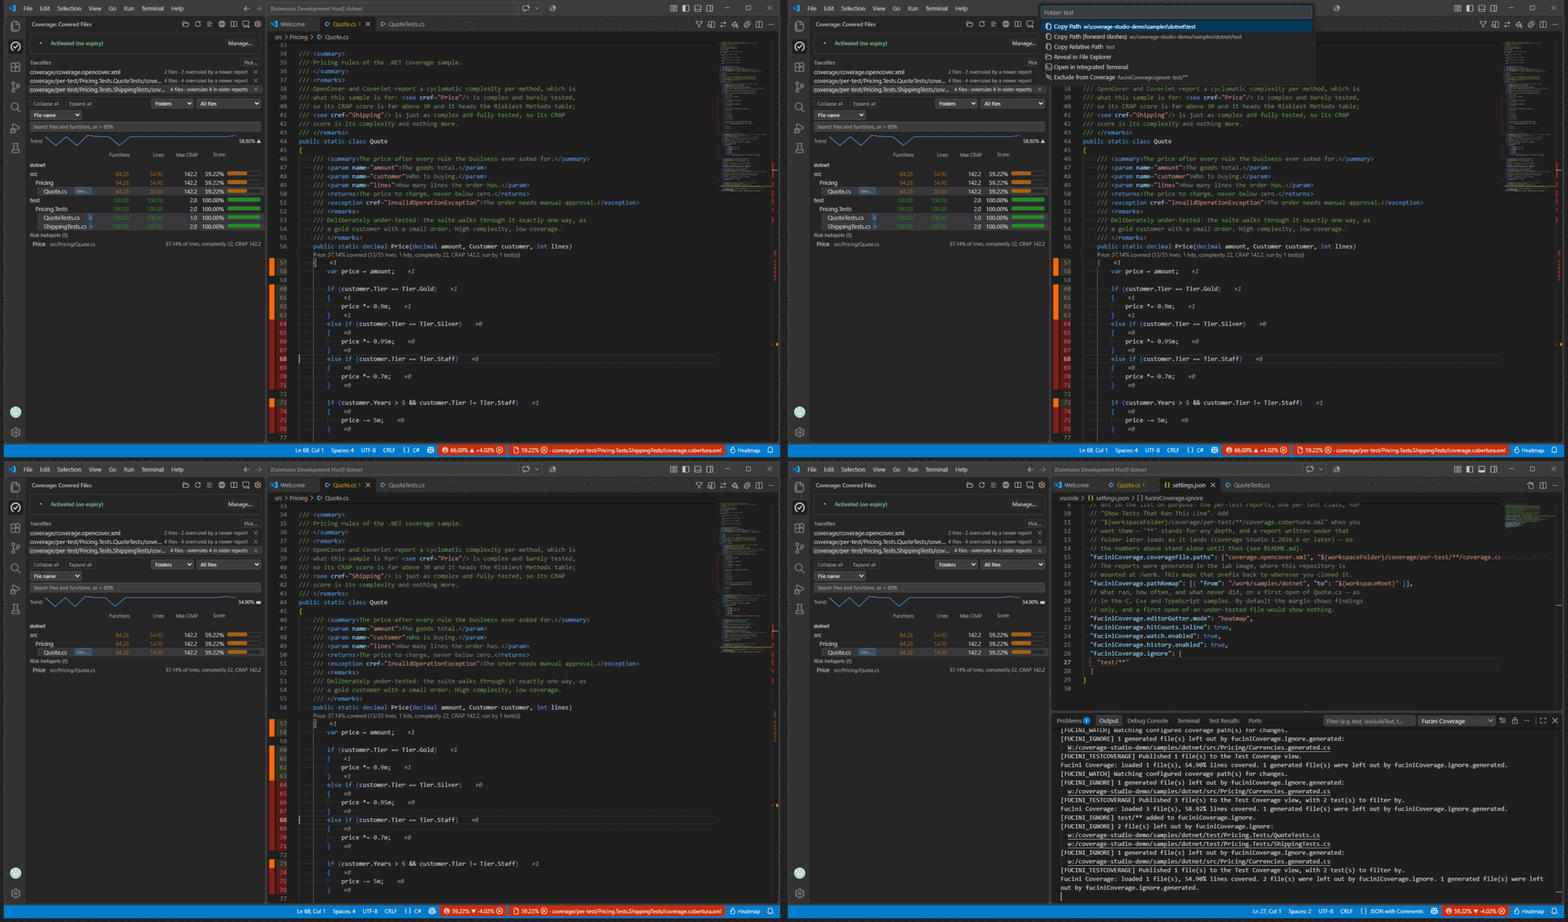 Screenshot pending — add assets/img/exclude-from-tree.gif (see SCREENSHOTS.md).
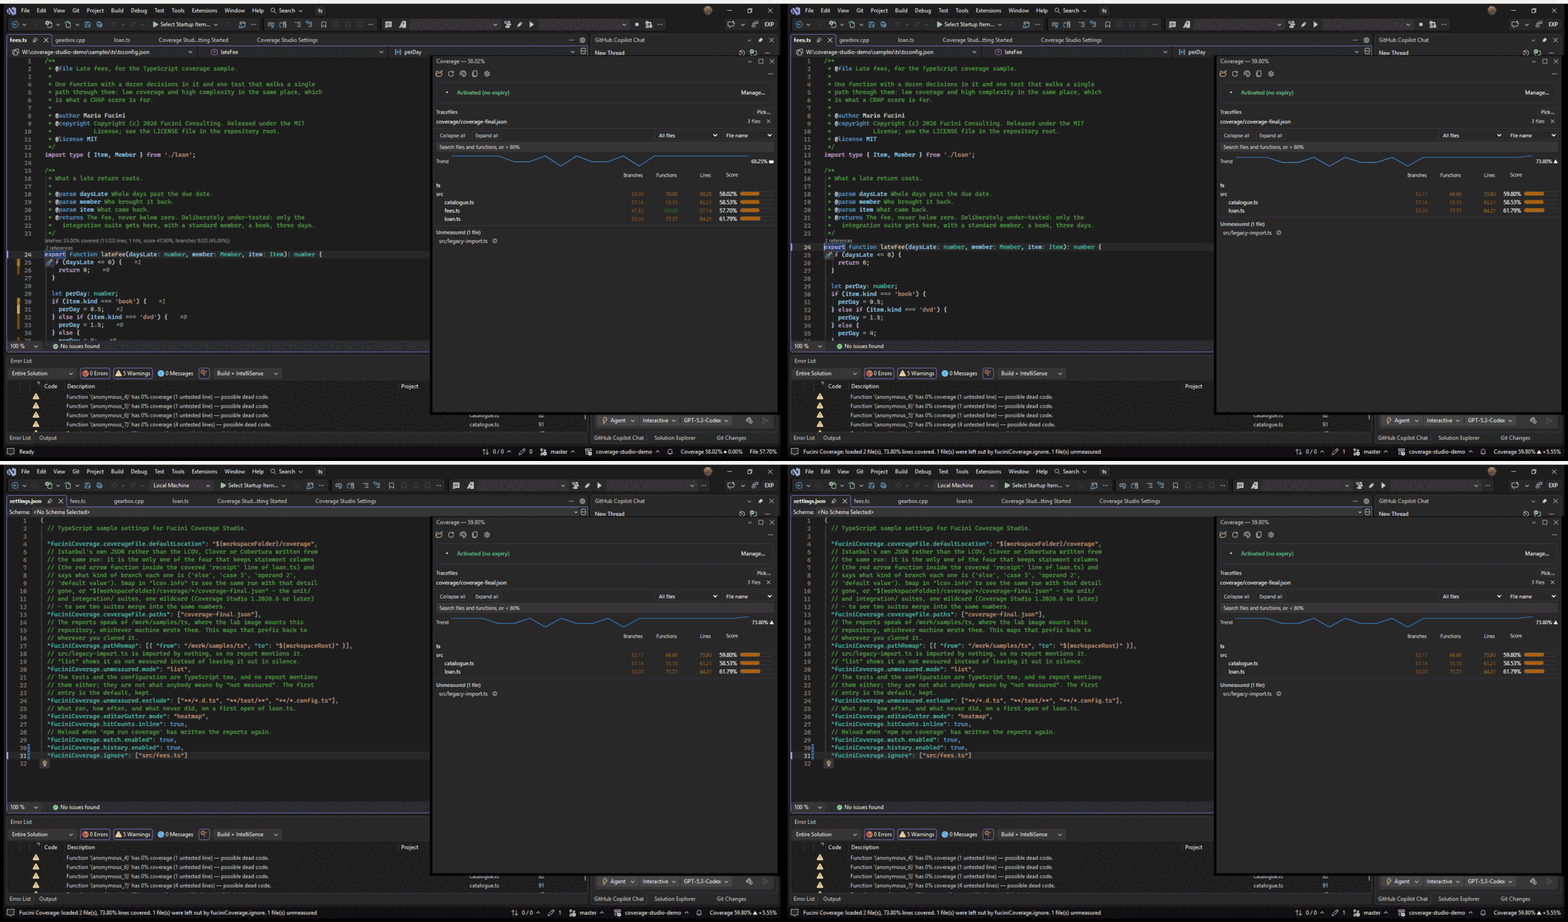
fees.ts — the tree without it, the pattern in .vscode/settings.json.Attributes and namespaces, for .NET
Two settings read off the source what the report cannot say. ignore.attributes — ExcludeFromCodeCoverage by default — excludes the class, method or property below an attribute it names, as LCOV_EXCL_START/STOP would, whatever tool wrote the report: Coverlet honours the attribute, OpenCover, dotCover and a converted lcov do not, and now all of them agree. Names with or without the Attribute suffix, with or without a namespace; add GeneratedCode, Obsolete or your own. ignore.namespaces leaves out every file whose namespace declaration matches a prefix, * as the wildcard — Acme.Generated, Acme.*.Migrations, *Tests — and the Output pane names the files it took. Both are read in the same pass that reads the comment markers, in both editions.
{
  "fuciniCoverage.ignore.attributes": ["ExcludeFromCodeCoverage", "GeneratedCode"],
  "fuciniCoverage.ignore.namespaces": ["Acme.Generated", "*.Migrations"]
}
Excluding from the editor
Select the lines and take Exclude Selection from Coverage from the light bulb, the editor's context menu or the Command Palette — in Visual Studio the light bulb (Ctrl+.), the code window's right-click menu, Tools → Coverage Studio or Ctrl+Shift+U, X — and the exclusion is written where the code is: [ExcludeFromCodeCoverage] above a C#, VB or F# class, method or property, by its short name when the file already imports System.Diagnostics.CodeAnalysis and fully qualified when it does not, so that no using has to be added; LCOV_EXCL_LINE at the end of one line of code; LCOV_EXCL_START and LCOV_EXCL_STOP around several, at the first line's indentation — with the language's own comment sign, //, #, ', -- or ;. One undo step. The light bulb also offers it on a line the Problems entries mark as uncovered. A line already marked, or a member already attributed, is left as it is.
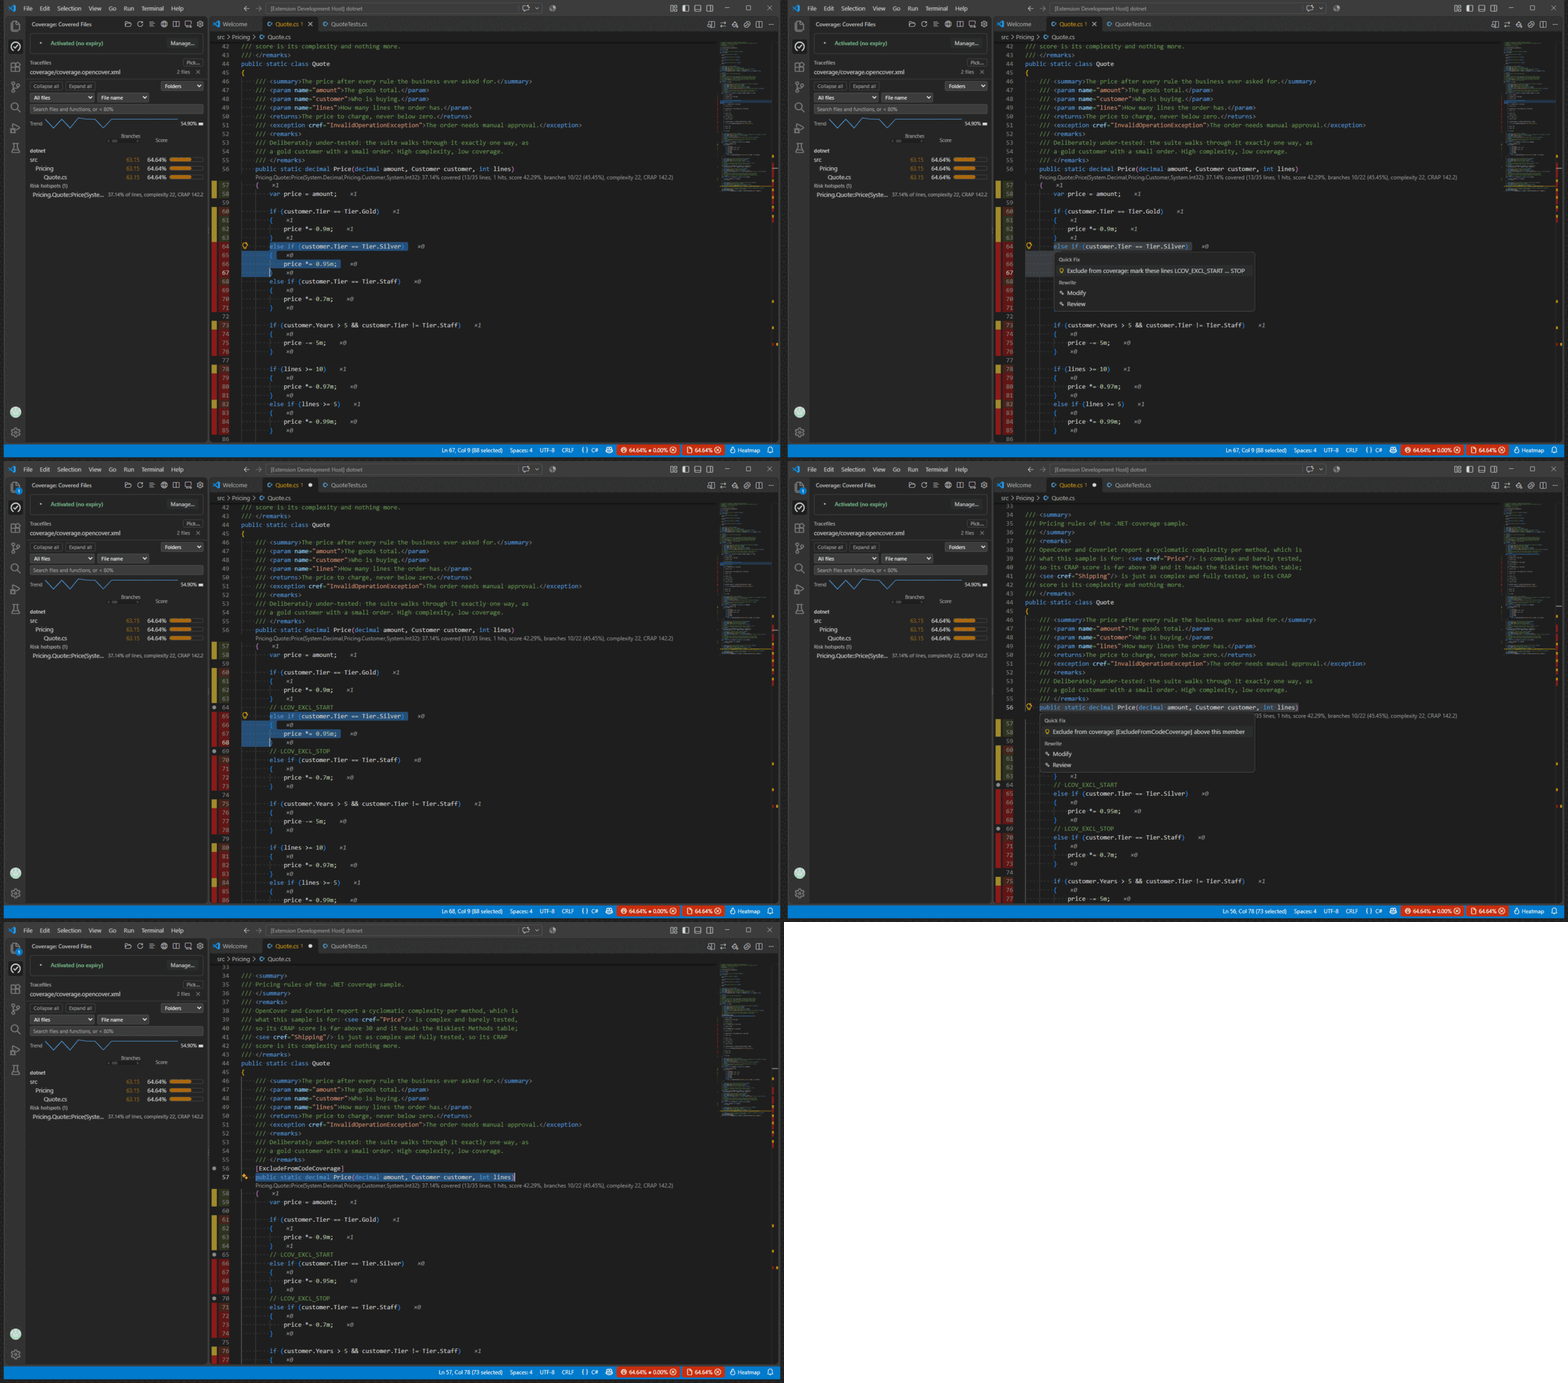 Screenshot pending — add assets/img/exclude-selection.gif (see SCREENSHOTS.md).
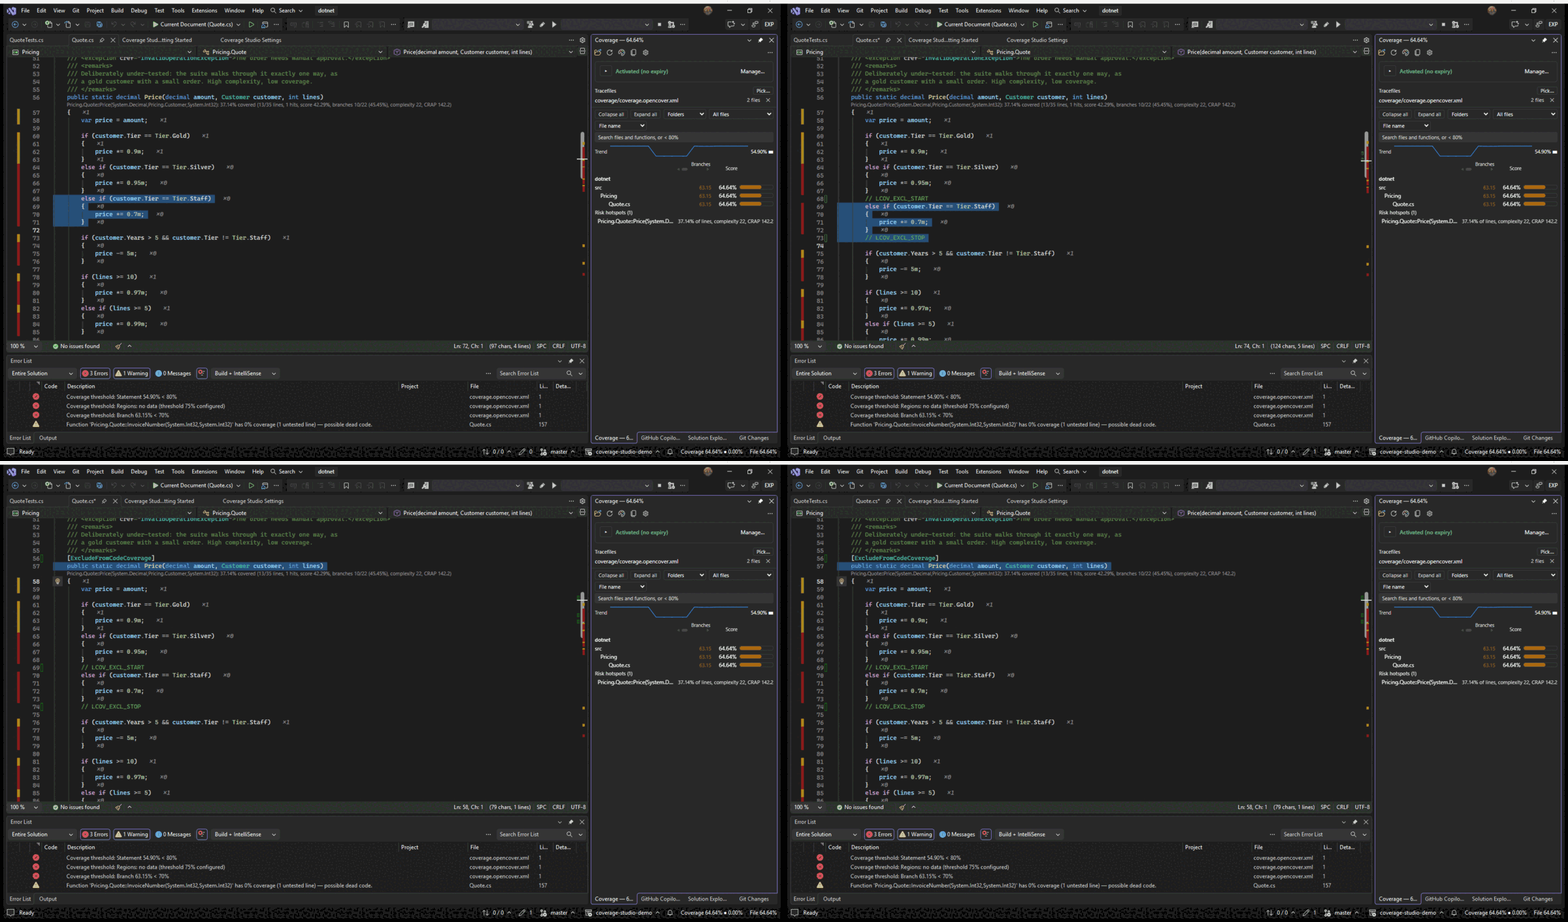
LCOV_EXCL markers around a branch, then [ExcludeFromCodeCoverage] above a method.An excluded line is grey, not nothing. A line taken out of the count on purpose — LCOV_EXCL_LINE, a region, [ExcludeFromCodeCoverage], or the report itself — used to be drawn like a line with no code at all, so once the coverage gutter mode put green on every line that ran, it could not be told from an untested one. It now gets a grey bar in the gutter and, where the line highlight is on, a grey wash, with how it was taken out and the reason written beside it on the hover; the statement hover says the same instead of going quiet. A comment the exclude pass took out is not marked, and a gap on the same line wins. fuciniCoverage.excluded.showMarks: false turns the marks off. The same in Visual Studio, bar and Quick Info alike.
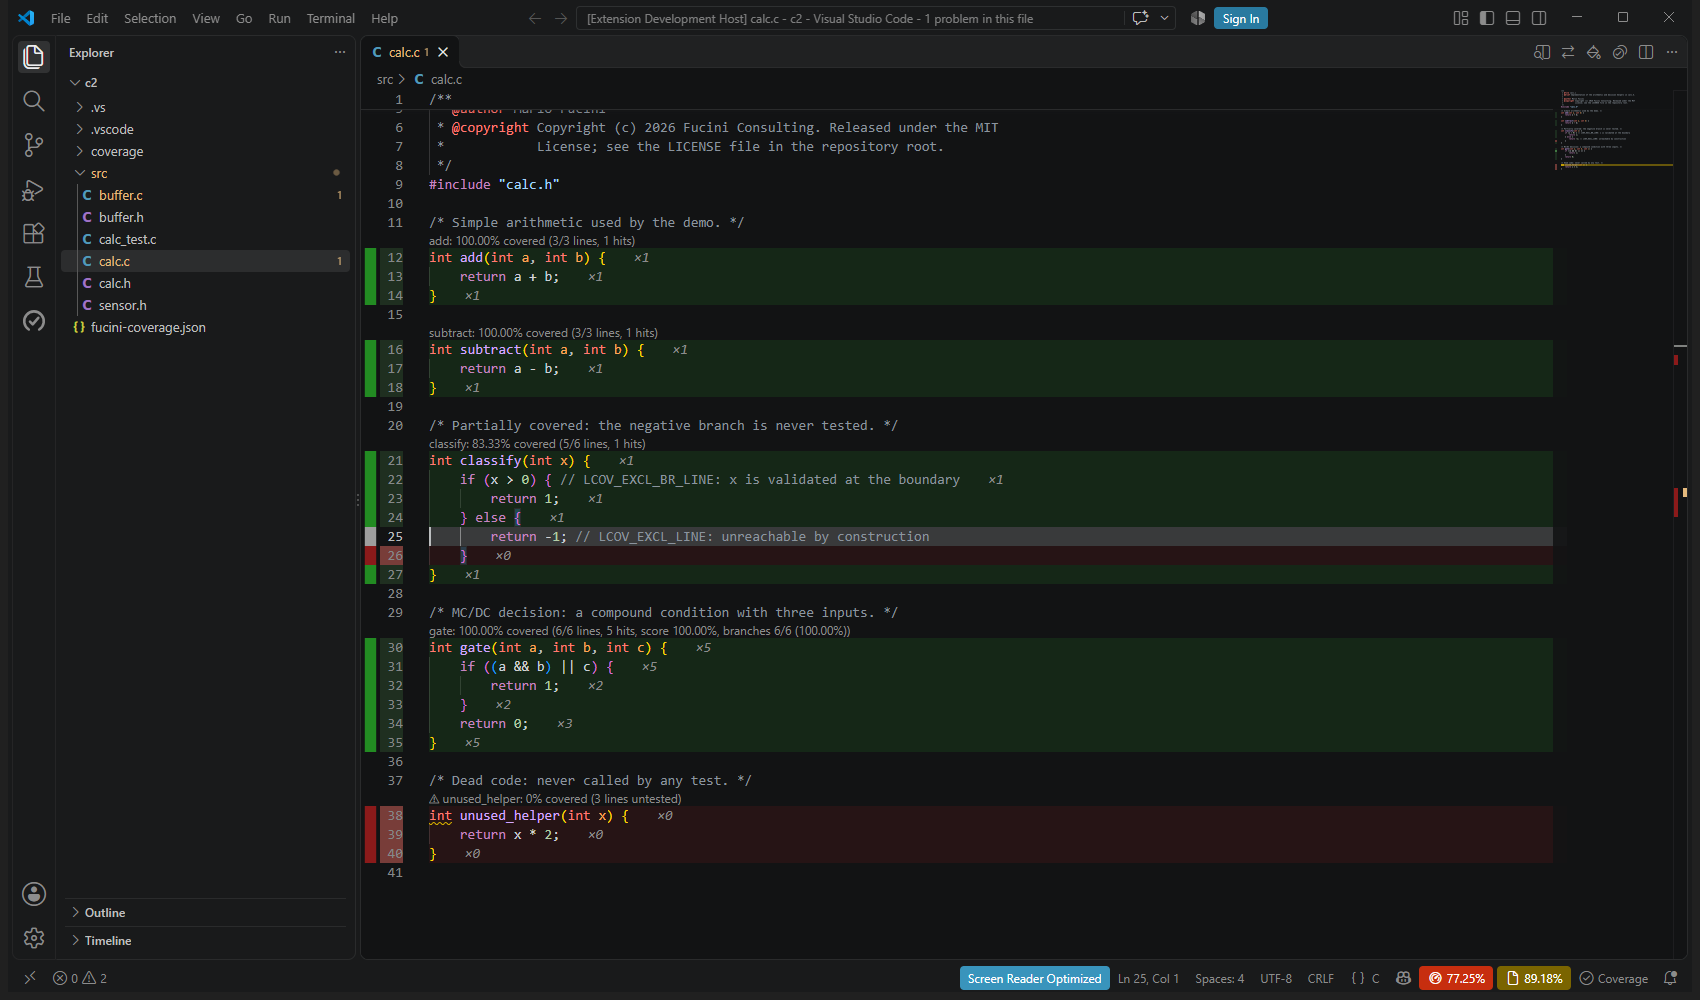 Screenshot pending — add assets/img/excluded-grey.png (see SCREENSHOTS.md).
LCOV_EXCL_LINE — three answers, not two.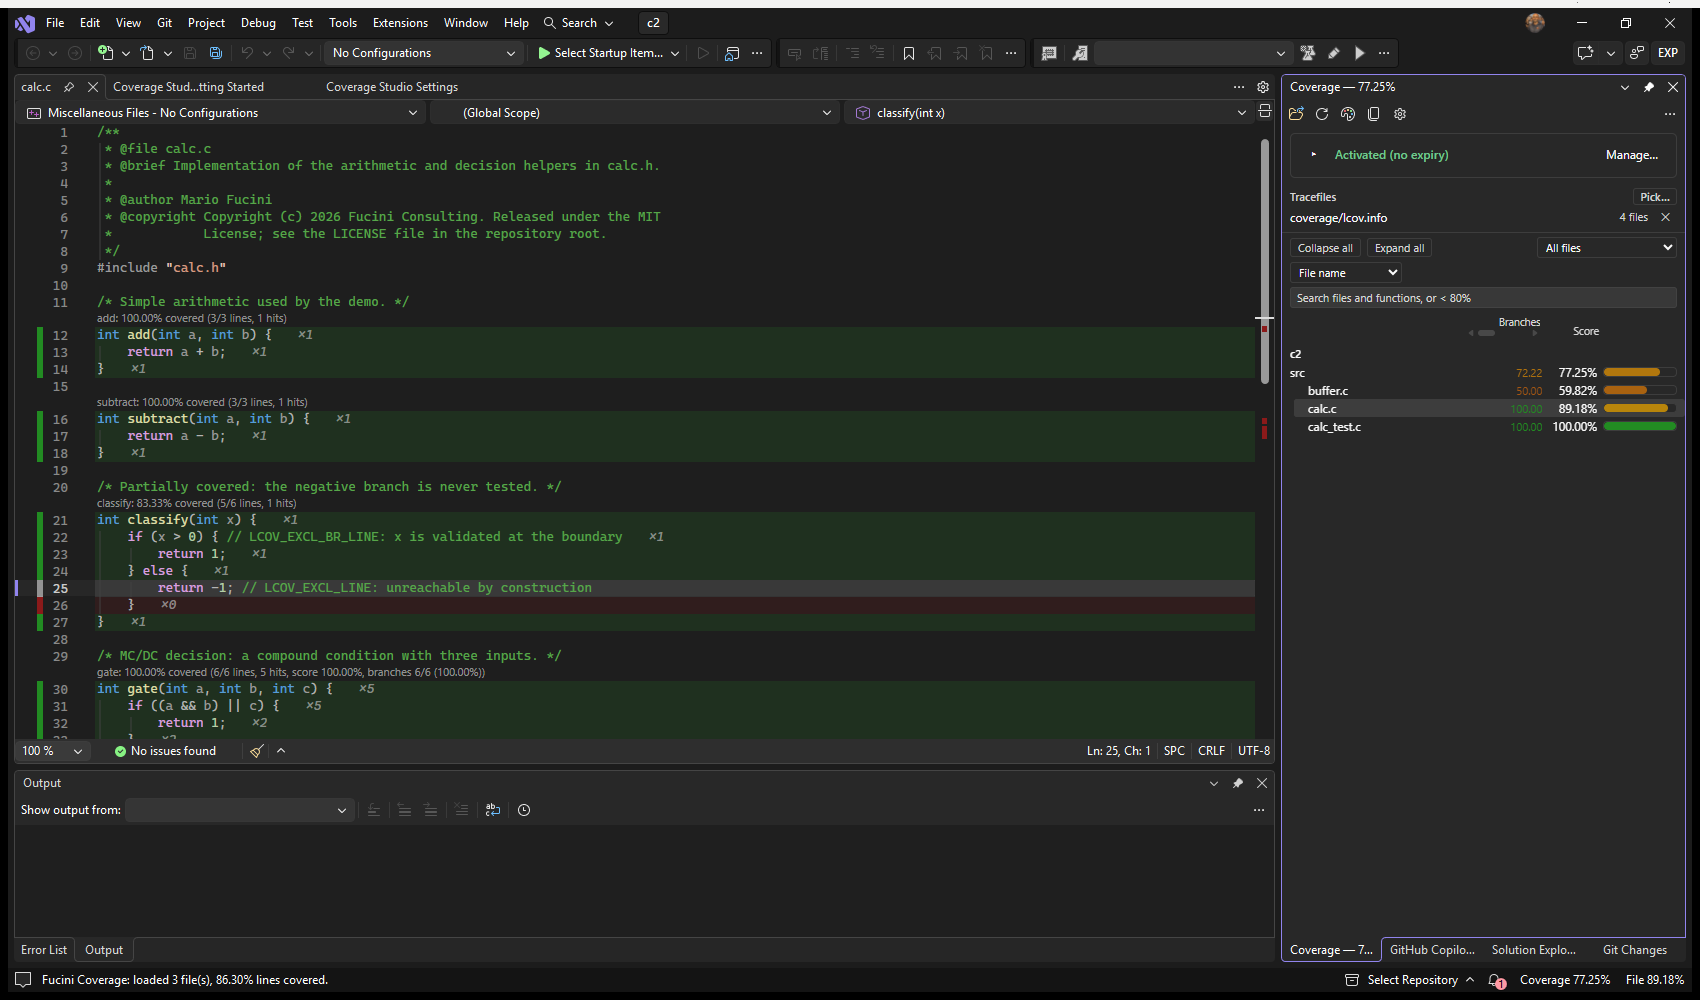 Screenshot pending — add assets/img/vs-excluded-grey.png (see SCREENSHOTS.md).
Branches only, and gcovr's markers
A defensive else, a default: no value reaches, the arm a compiler adds for an exception: the line runs and should count, and only its branch cannot be taken. LCOV_EXCL_BR_LINE and LCOV_EXCL_BR_START … LCOV_EXCL_BR_STOP take the branches on their lines out of the count and leave the lines in it. LCOV_EXCL_EXCEPTION_BR_LINE and its region take less still — only the arms an exception reaches, where the report says which those are, as gcov's JSON does. Every marker is read under gcovr's prefixes as well: GCOVR_EXCL_LINE, GCOVR_EXCL_START, GCOVR_EXCL_BR_LINE, GCOV_EXCL_STOP and the rest mean what the LCOV_EXCL_ ones mean, so a source written for gcovr reads the same here whatever tool made the report. Not read: GCOVR_EXCL_FUNCTION — nothing on that line says where the function ends.
if (handle == NULL) return E_FAIL; // LCOV_EXCL_BR_LINE: the allocator never fails on target
// LCOV_EXCL_BR_START generated state table
switch (state) { /* … */ }
// LCOV_EXCL_BR_STOP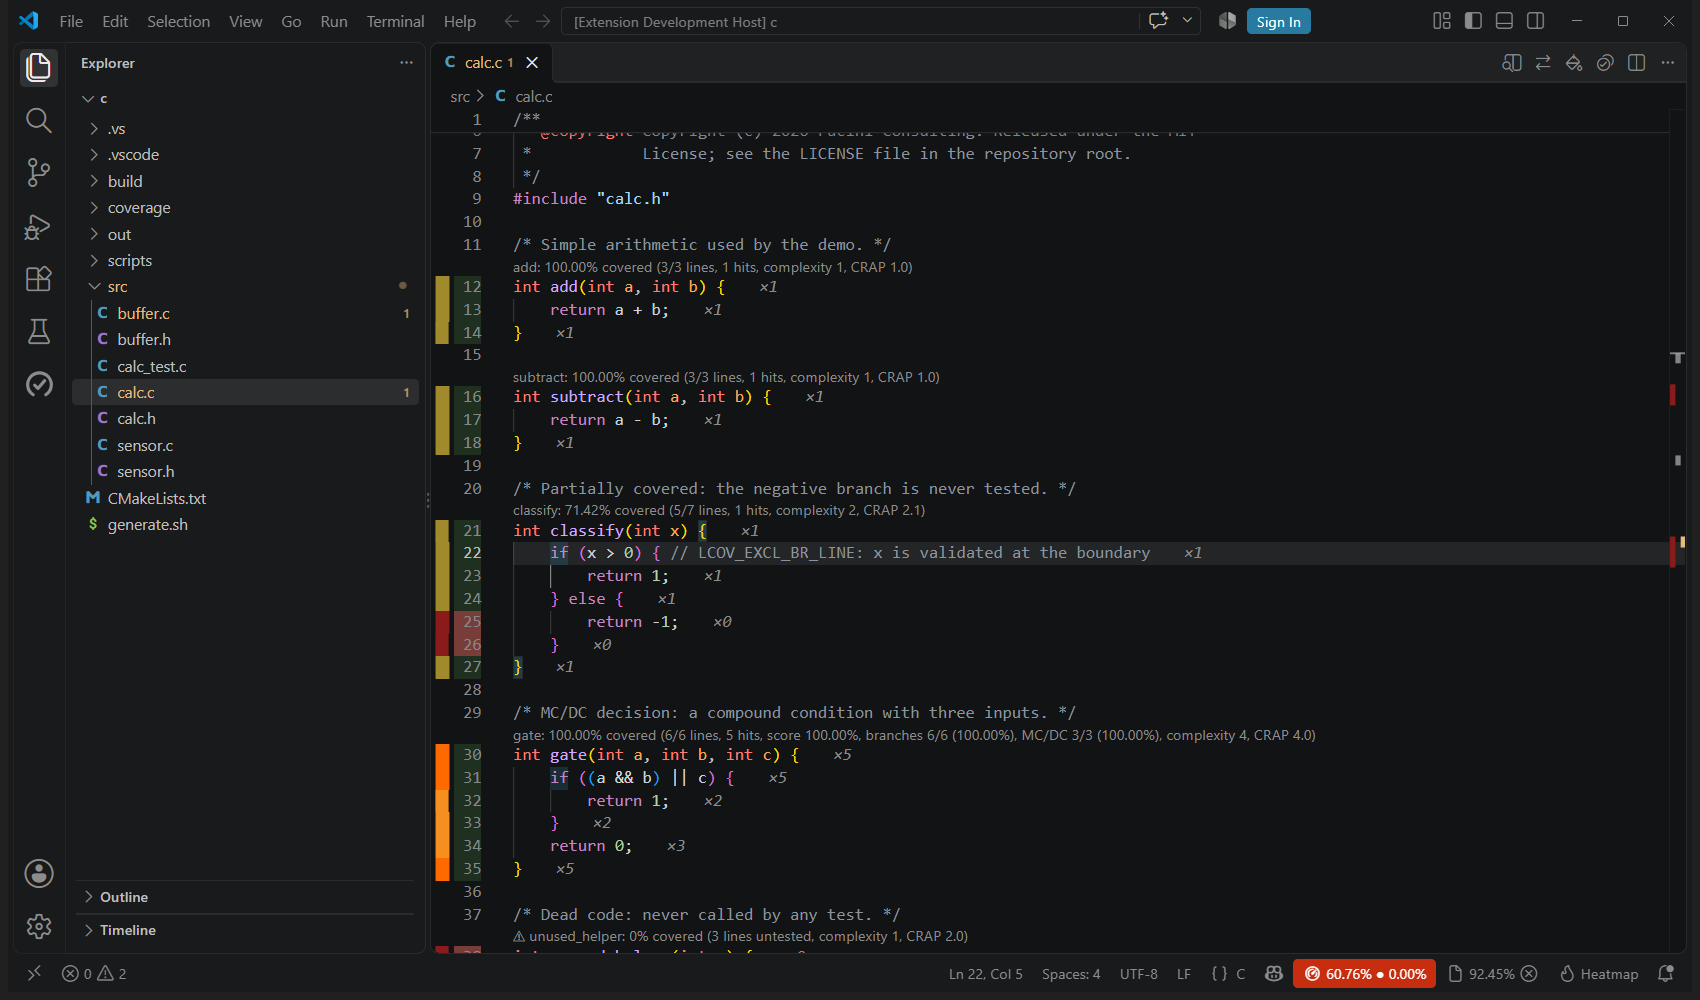 Screenshot pending — add assets/img/branch-markers.png (see SCREENSHOTS.md).
Saying why: justified exclusions
Taking code out of the count is a claim — "this cannot be tested", "this is a developer aid" — and under DO-178C, ISO 26262 or IEC 61508 a claim that changes the number a certificate rests on has to be written down and reviewable. So an exclusion can say why, in the place it is written: the text after LCOV_EXCL_LINE or LCOV_EXCL_START, or the Justification of [ExcludeFromCodeCoverage].
abort();                 // LCOV_EXCL_LINE: defensive, unreachable by construction
  // LCOV_EXCL_START debug dump, never built for the target

  [ExcludeFromCodeCoverage(Justification = "a developer aid")]
  public static void DebugDump(decimal amount) { /* … */ }
The reasons are read at every load and the log counts them. Export Coverage Report… writes the list — exclusions and their justifications, as Markdown or CSV: the file, the lines, how it was written, and the justification or none given. A file left with nothing measurable is still in that list. With exclusions.requireReason on, an exclusion that gives no reason is a finding: a warning in Problems at its line, and a failure of Check Coverage Thresholds. Exclude Selection from Coverage then asks for the reason first and writes it with the marker or as the attribute's Justification; dismissed or left empty, nothing is excluded.
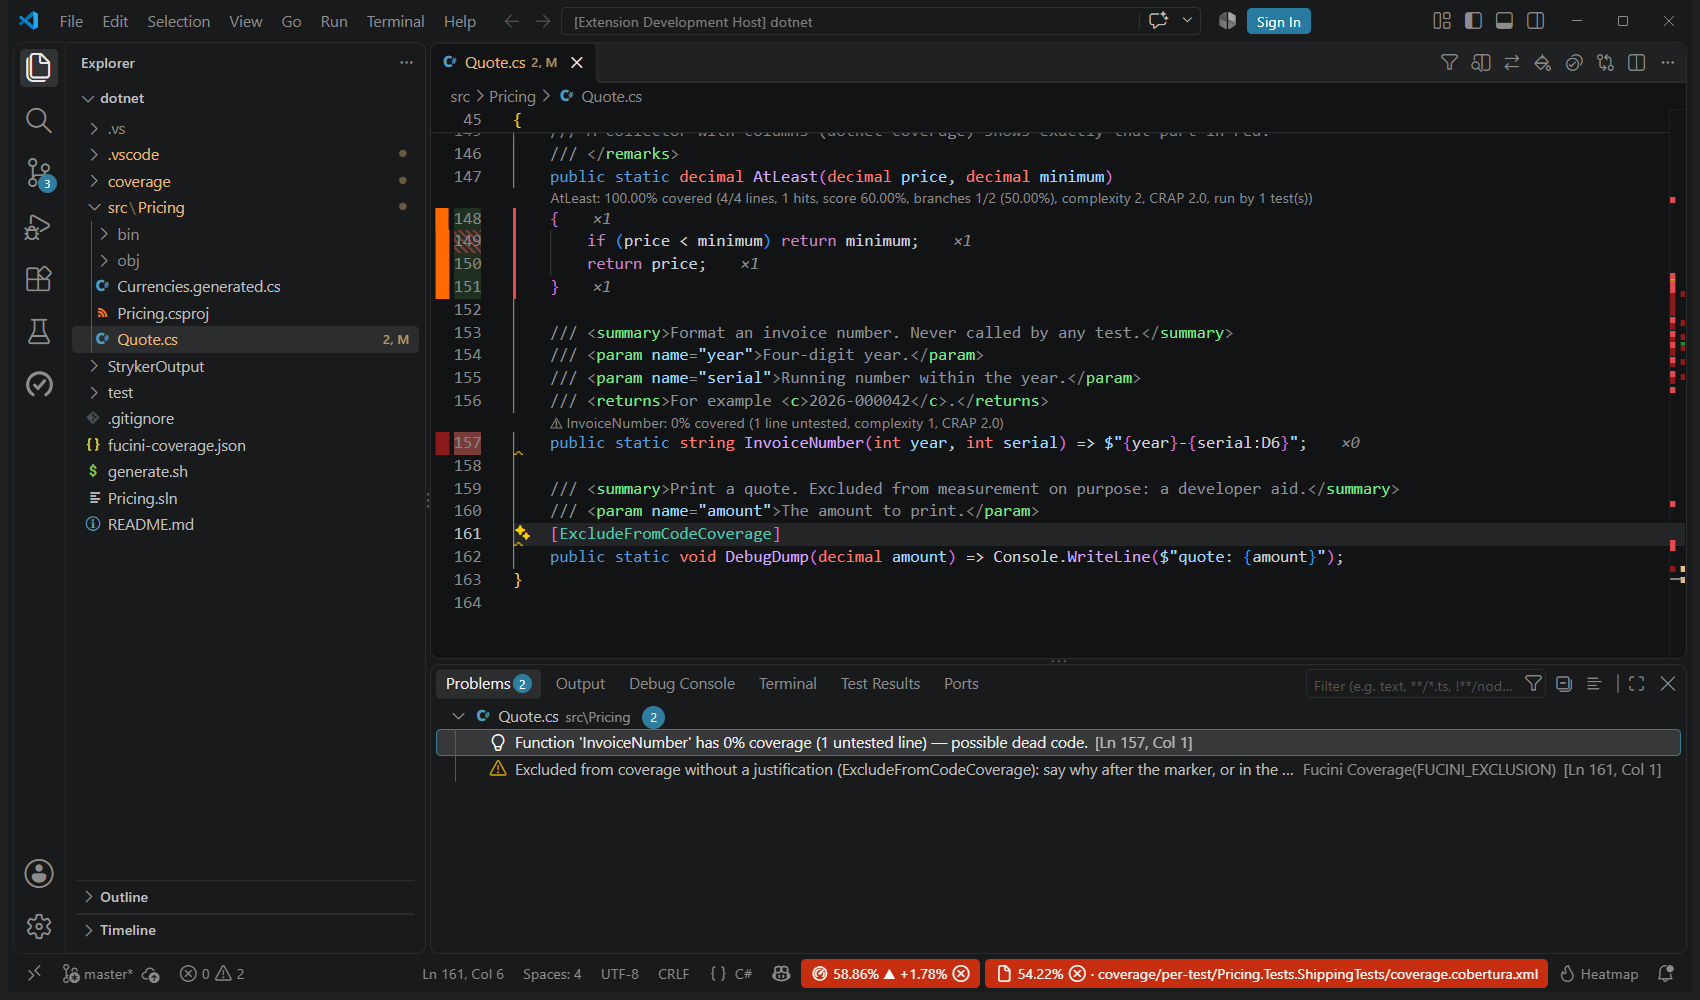 Screenshot pending — add assets/img/justified-exclusions.png (see SCREENSHOTS.md).
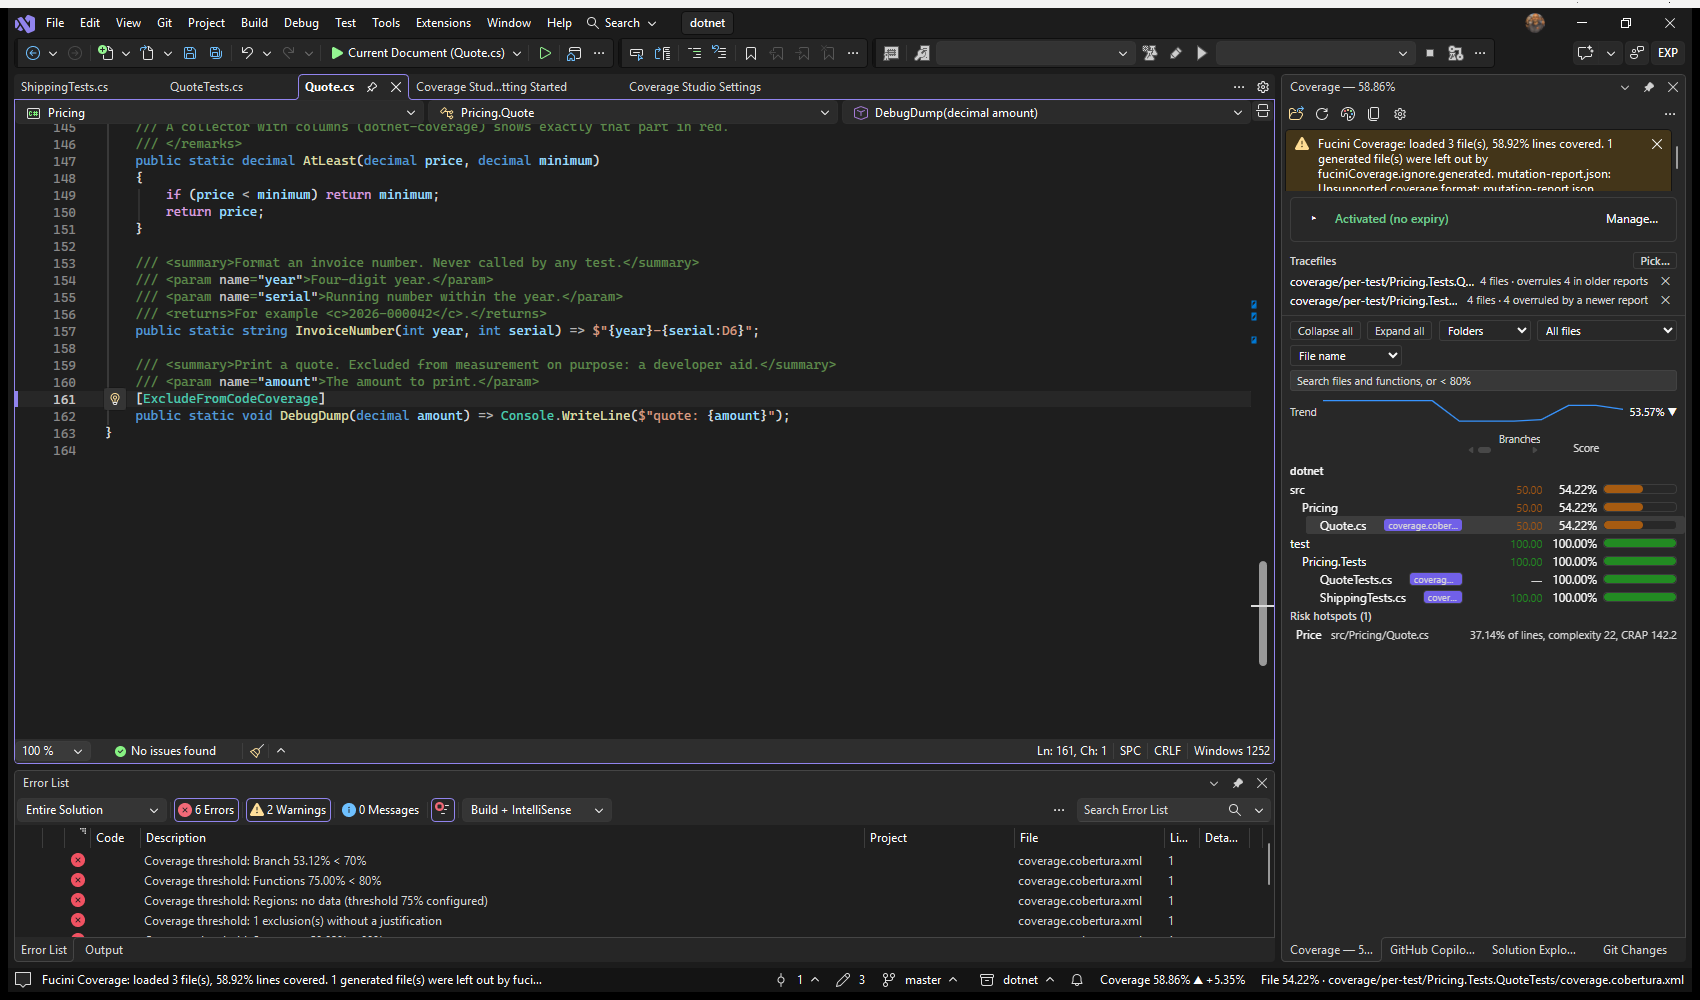 Screenshot pending — add assets/img/vs-justified-exclusions.png (see SCREENSHOTS.md).
12a. Does this coverage still describe this file?
Coverage read from a tracefile describes the source as it was when the tests ran, and most formats say nothing about which version that was. Every file in the Coverage panel is therefore in one of three states:
- ✓ Verified — the tracefile records what each measured line said, and it still matches the file.
- Nothing shown — not disproved. Nothing contradicts the coverage and nothing confirms it. This is the ordinary state.
- ⚠ Contradicted — the file itself disproves its coverage. The row is dimmed and the tooltip says what was found.
Only two formats can earn the tick, because only two record anything about the source they measured: lcov written with --checksum (off by default in geninfo; its documented purpose is to stop coverage from one version of a file being combined with another), and GNATcoverage XML, which embeds the text of every line it measured. Turning the lcov option on is worth it.
The warning needs neither, and works with every format: coverage recorded past the end of the file, a named function that is no longer where the report puts it, or executed lines that are blank in the file. Timestamps are never enough on their own — a git checkout moves every one without changing a byte — so a moved timestamp is at most a reason to look again. The check runs when coverage is loaded and again whenever a file is saved or changes on disk, so the mark follows the file: an edit that contradicts the run sets it, a checkout that restores the measured version clears it. The tooltip says exactly what proved it. Set staleWarning.enabled to false to switch all of it off.
12b. Unmeasured versus uncovered
A file the run never mentions is unmeasured: no test loaded it, so no tool wrote a line for it. That is not the same as uncovered — measured, with zero hits — and the extension has never scored an absent file as 0%. What it did not do, until 0.2026.69, was show the absent ones at all: a module with no tests whatsoever never appeared in the tree, the totals or the threshold check, and a reader saw “92%” for a project half of whose files had never been exercised.
Now, with a run loaded, the per-file status-bar item says not measured for a source file of the run's own kind that the run does not contain — “of the run's kind” meaning it has one of the file extensions the run measured, so a C project's headers and sources are candidates and its Python scripts are not. Everything beyond that is opt-in through fuciniCoverage.unmeasured.mode:
off(default) — nothing else changes.list— the Coverage view gets an Unmeasured group at the bottom naming every such file, each row opening it; the load result counts them; badges mark them?in the Explorer; andfuciniCoverage.threshold.unmeasuredFilescan fail Check Coverage Thresholds when there are more than a number you set. No percentage moves.count— everythinglistdoes, and each unmeasured file also counts against the run as an uncovered file of its own code lines, so the status bar, the thresholds, the badges, history, every export and the Test Coverage view show the lower number. The file is drawn as unmeasured wherever it appears, its gutter bars say “not measured” rather than “never ran”, and the mismatch check leaves it alone — there is no measurement for its contents to contradict.
{
  "fuciniCoverage.unmeasured.mode": "list",
  "fuciniCoverage.threshold.unmeasuredFiles": 0
}
Header files are the known false positive in C: they have the run's extension family and no tracefile will ever name one, because on its own it compiles to nothing. fuciniCoverage.unmeasured.exclude therefore leaves out **/*.h, **/*.hpp, **/*.hh, **/*.inl and **/*.d.ts by default, in the same glob syntax as fuciniCoverage.ignore; add a platform port that is not built here, or generated stubs, and they drop out of the list, the count and the status-bar state. A file ignore names is never called unmeasured either — leaving it out was the point. threshold.unmeasuredFiles defaults to -1, which does not check; 0 fails the moment any file of the run's kind was never loaded by a test, and it only applies while unmeasured.mode is list or count.
A file the report names that is not on disk is the other way round: measured, but not there — a generated file the build deleted again, a helper of a dependency, a path no remap caught. It counts by default, since the report says it ran, and the Coverage view lists it. fuciniCoverage.missingSources.includeInTotals: false leaves such files out of the totals and the views, and the log names what was left out, file by file (FUCINI_MISSING_001), so that a remap which would bring them back can be written. The same setting in Visual Studio's fucini-coverage.json; on the command line, --exclude-missing-sources.
13. HTML reports
- Generate Full HTML Report — a self-rendered, multi-page, per-directory report. Output goes to
htmlReport.outputDir, or the extension's global storage when unset. - Open Annotated Source — a single-file annotated view. Point
externalHtmlReport.dirat a pre-builtllvm-cov show --format=htmldirectory to use those pages instead of the built-in renderer. - Export Fucini JSON — the full normalised model for your own tooling.
- Export Coverage Report... — the run as CSV (per file or per function), a Markdown summary, an LCOV tracefile, Cobertura XML, SARIF, or a self-contained SVG badge for your README. Also reachable from the button beside Generate Full HTML Report in the Covered Files view. Everything except the CSVs is lossy — MC/DC, regions and instantiations have nowhere to go in LCOV, Cobertura or SARIF — so Fucini JSON and the CSVs stay the formats that carry every metric.
- Copy Uncovered Lines — a Markdown summary of every gap, ready to paste into a PR.
In Visual Studio. The Reports group of Tools → Coverage Studio: Show Annotated Source opens the active document as a page in the document well — every line in its colour, the findings beside it — scrolled with the editor in both directions; Open HTML Report writes the one-page report to htmlReport.outputDir (or %LOCALAPPDATA%\Fucini\CoverageStudio\html-report) and opens the browser; Generate Full HTML Report writes the index per folder and the page per file there; Export Coverage Report… offers the same eight formats and asks where to save; Generate Coverage Badge writes the badge where badge.outputPath says, after every load with badge.autoUpdate. The annotated page needs WebView2, as the Coverage window does; the reports on disk do not.
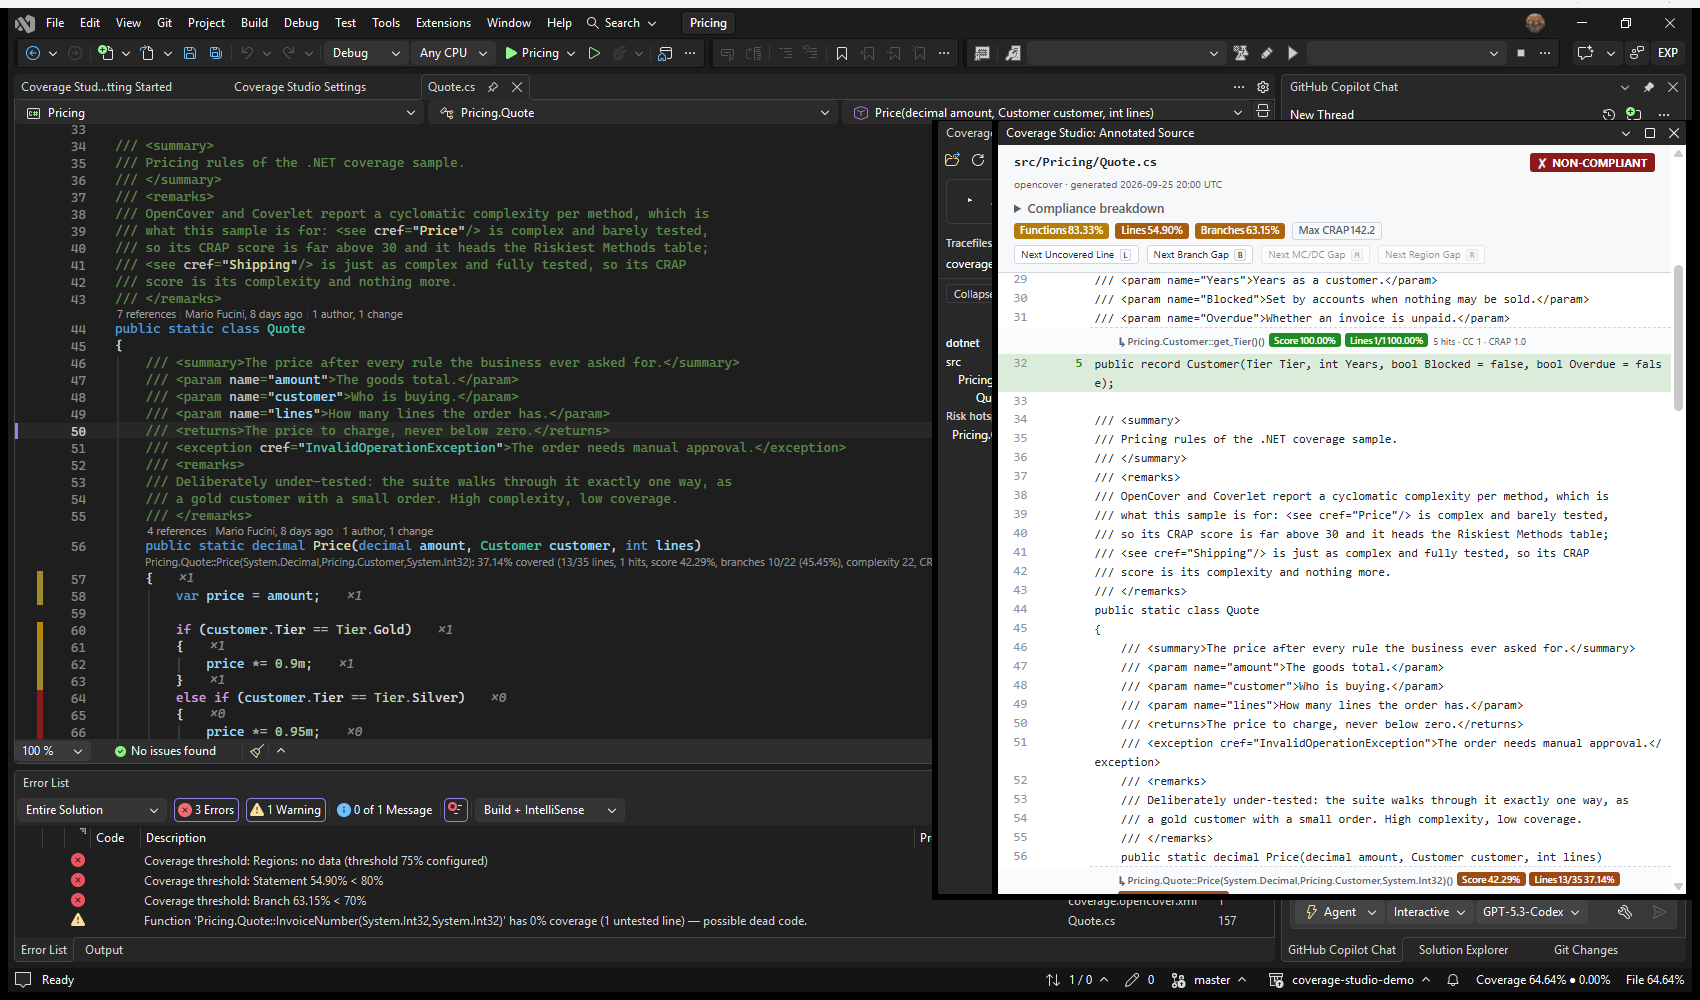 Screenshot pending — add assets/img/vs-annotated-source.png (see SCREENSHOTS.md).
 Screenshot pending — add assets/img/report.png (see SCREENSHOTS.md).
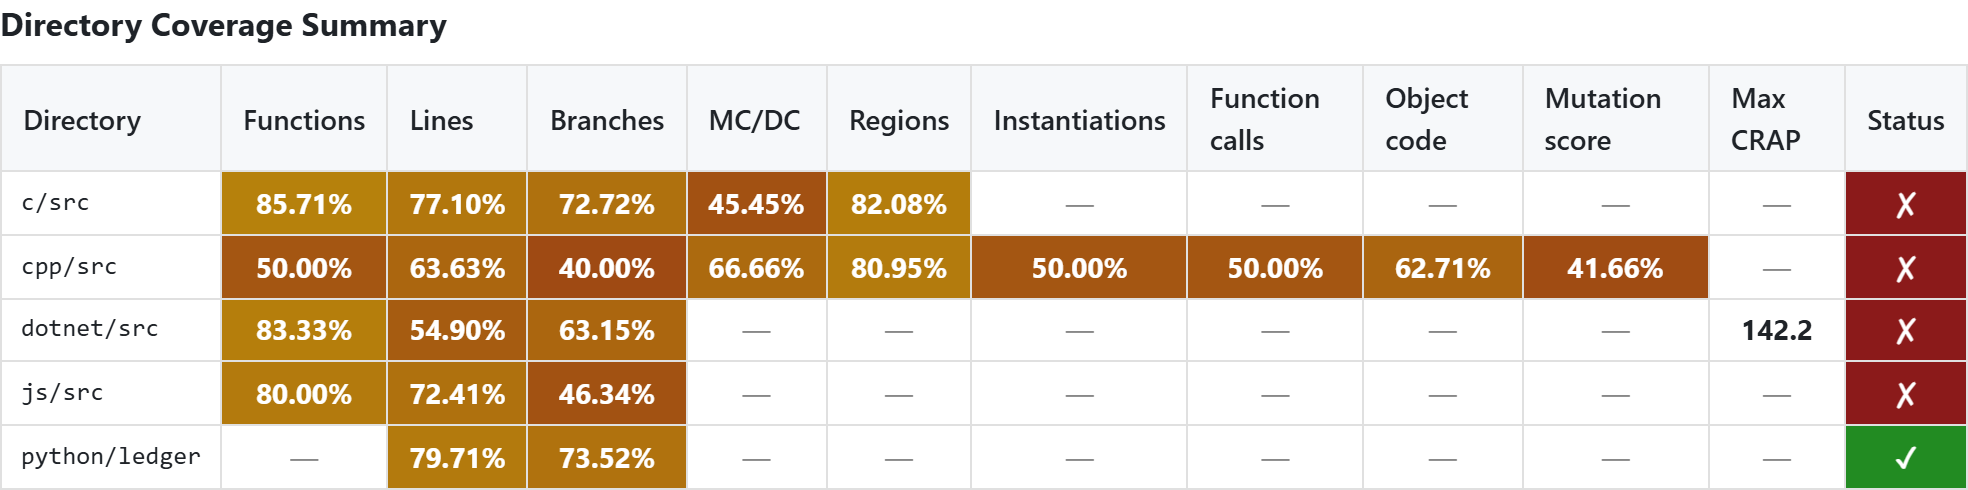 Screenshot pending — add assets/img/report-directory-summary.png (see SCREENSHOTS.md).
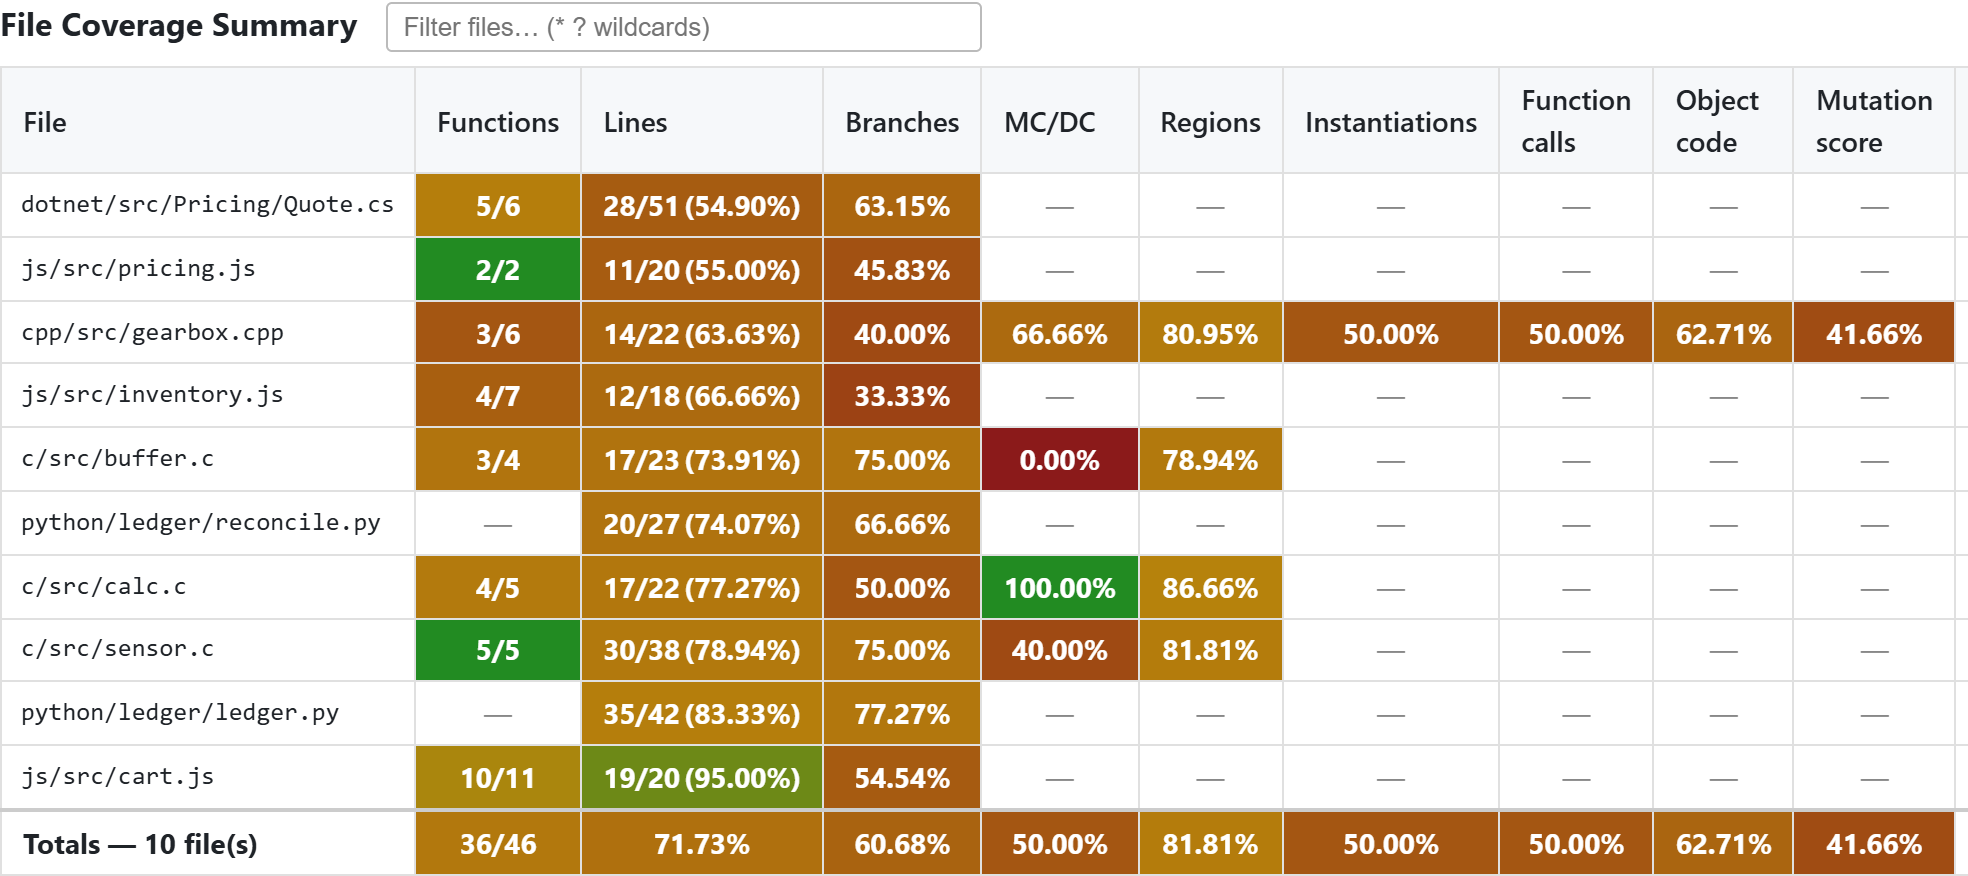 Screenshot pending — add assets/img/report-file-summary.png (see SCREENSHOTS.md).
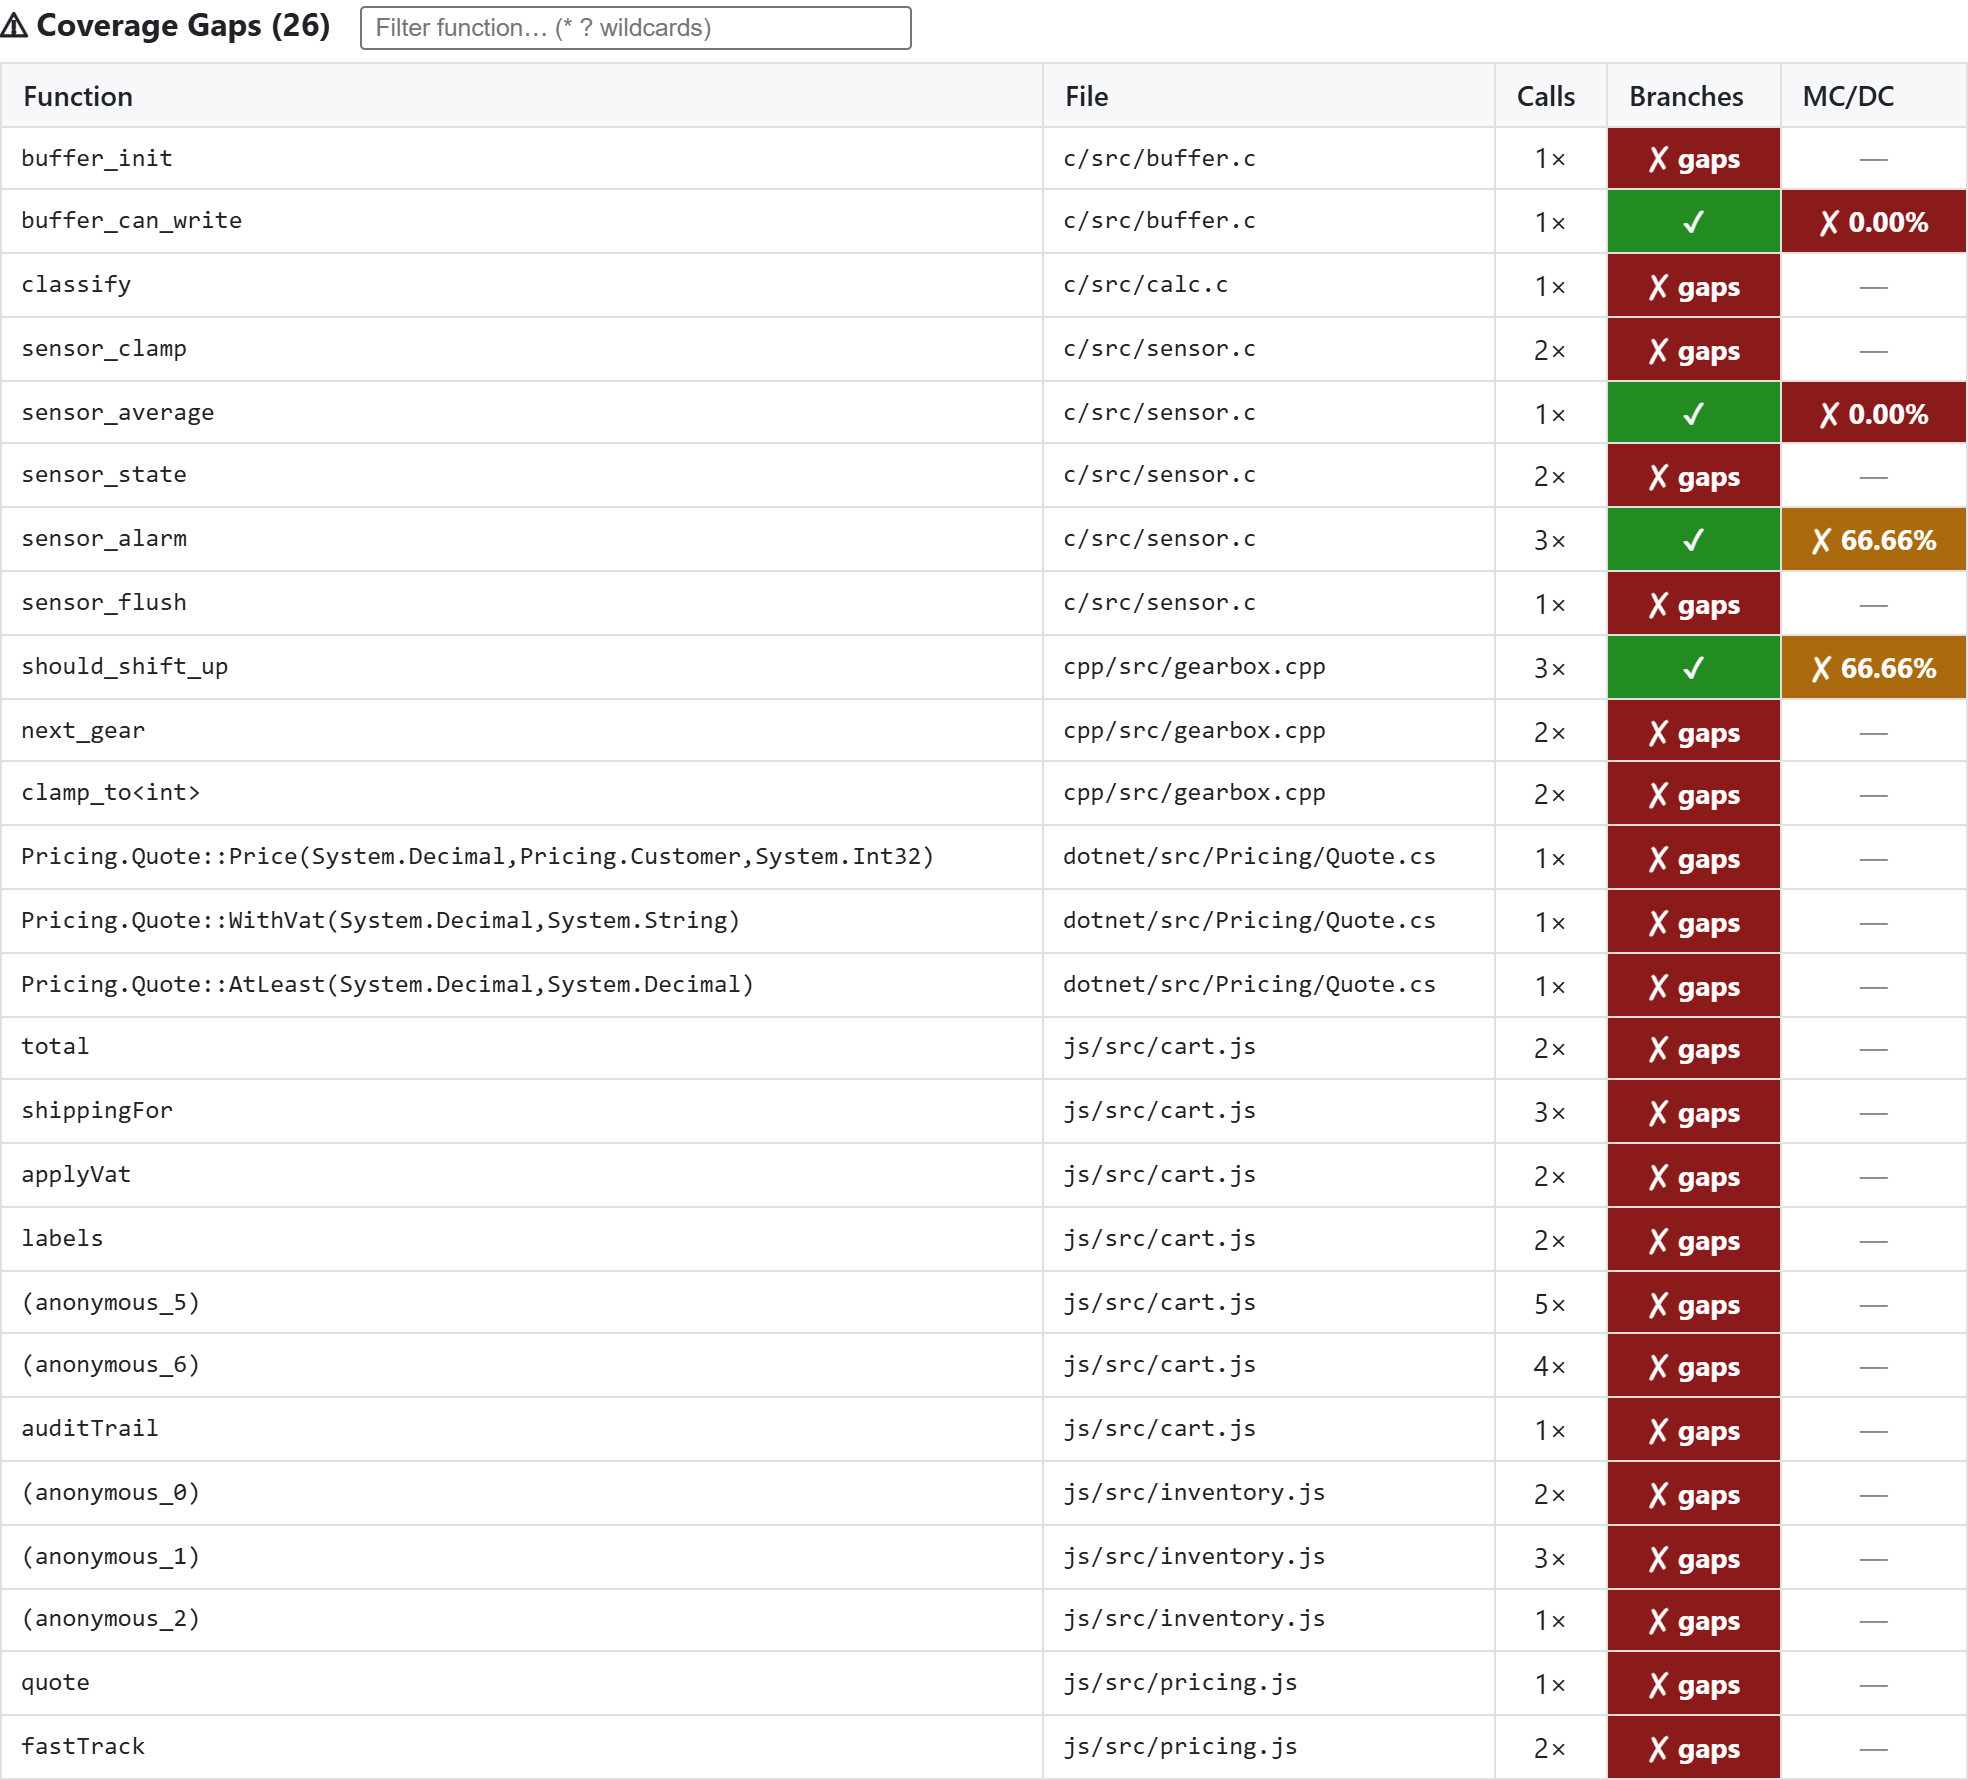 Screenshot pending — add assets/img/report-coverage-gaps.png (see SCREENSHOTS.md).
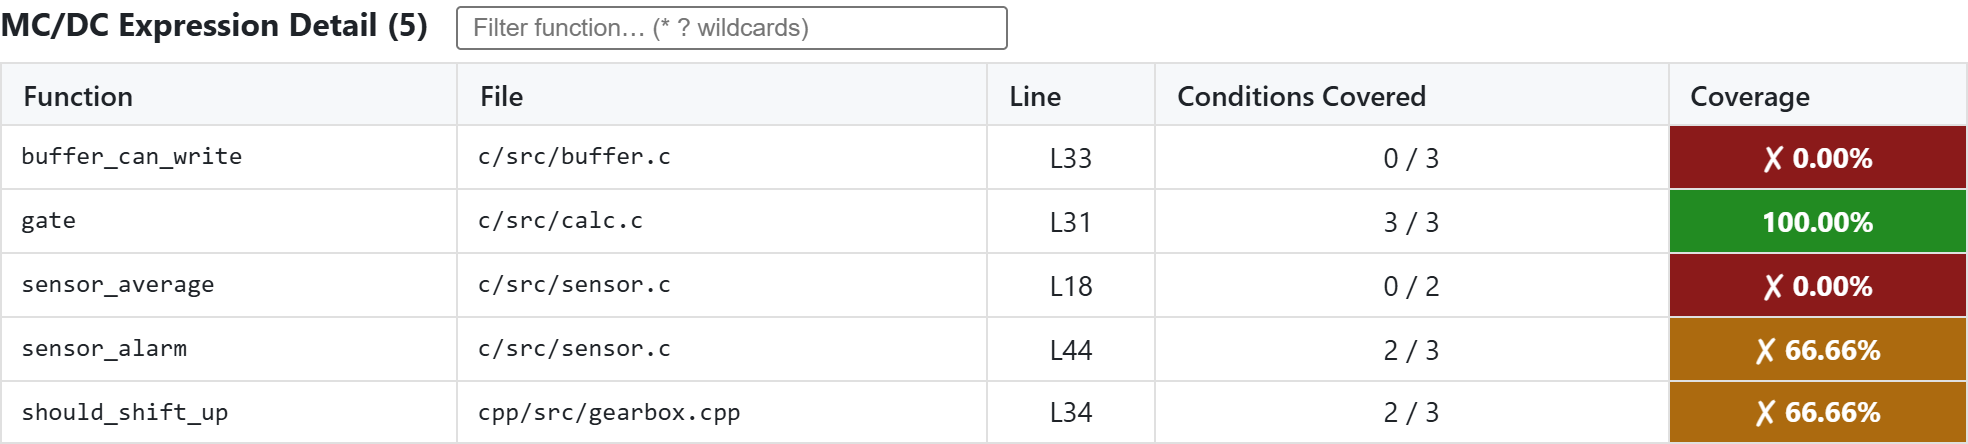 Screenshot pending — add assets/img/report-mcdc-detail.png (see SCREENSHOTS.md).
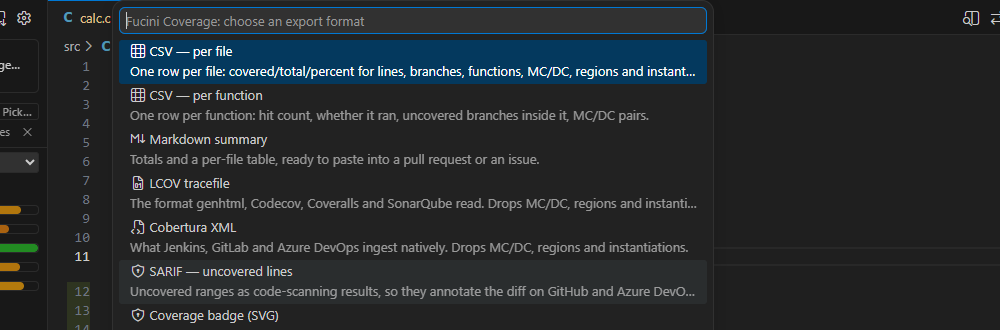 Screenshot pending — add assets/img/export-picker.png (see SCREENSHOTS.md).
 Screenshot pending — add assets/img/annotated-source.png (see SCREENSHOTS.md).
Annotated source vs. plain source
Open Annotated Source replaces the active tab with a colour-coded coverage webview for that file, in the same column; Open Annotated Source to the Side does the same but in a split, so source and annotated view sit next to each other. To flip back and forth in place instead — handy on a small screen where a split leaves each pane too narrow — use Toggle Annotated Source: it swaps the active tab between the two, remembering which one you're currently looking at. From inside the annotated view itself, Show Source jumps straight back to the plain editor for that file.
Which HTML you actually see depends on externalHtmlReport.dir: when it's set and a page matching the active file already exists there (llvm-cov lays per-file pages out as <repo-name>/<relative-path>.html, so the report's own repo-name folder never needs configuring), that toolchain-generated page is shown instead of the built-in renderer — its local links/stylesheet are rewritten to work inside the webview, and it carries detail the built-in view doesn't reproduce (MC/DC expansion views, region highlighting, directory rollups). No matching page for that file, or the setting left empty? The built-in renderer is used instead. The extension only ever reads this directory — it never writes into it.
A coverage badge for the README
Generate Coverage Badge writes a shields-style SVG for the active run into the workspace — badge.outputPath, default coverage-badge.svg, relative to the workspace folder or absolute, with the same variables as every other path setting — and offers to open it. It is a plain file in your repository, so a README embeds it with no service behind it, no shields.io round trip, and it works in an air-gapped repository too:

badge.metric picks what the badge shows: lines (labelled coverage), branches, mcdc or weighted, the same composite score the status bar shows, labelled score. A run without data for the chosen metric gets a grey n/a rather than a red 0%. The colour follows your own colorScale.* tiers: lowColor below lowThreshold, midColor up to highThreshold, highColor from there. With badge.autoUpdate on, the badge is rewritten after every successful load, silently, and the output channel records each write as [FUCINI_BADGE] — off by default because it writes into the workspace on every load. Commit the SVG with the code and the picture on the repository page follows the number in the editor.
{
  "fuciniCoverage.badge.outputPath": "docs/coverage-badge.svg",
  "fuciniCoverage.badge.metric": "weighted",
  "fuciniCoverage.badge.autoUpdate": true
}
14. History & trends
Enable history.enabled to persist runs locally (keeping history.retention of them). You then get a trend arrow (▲/▼) in the status bar, the trend chart in the Coverage view, and two comparison commands: Compare with Last Run and Compare Two History Runs, each producing a per-file regression/improvement diff.
In Visual Studio. Every load is compared with the one before: a triangle in the margin on each line that started or stopped running (sinceLastRun.enabled), the trend beside the score in the status bar, and Compare with Last Run for the files whose numbers moved. With history.enabled the runs are kept under %LOCALAPPDATA%\Fucini\CoverageStudio\history, history.retention of them, so the comparison survives a restart, the trend chart has something to draw, and Compare Two History Runs… picks any two of them.
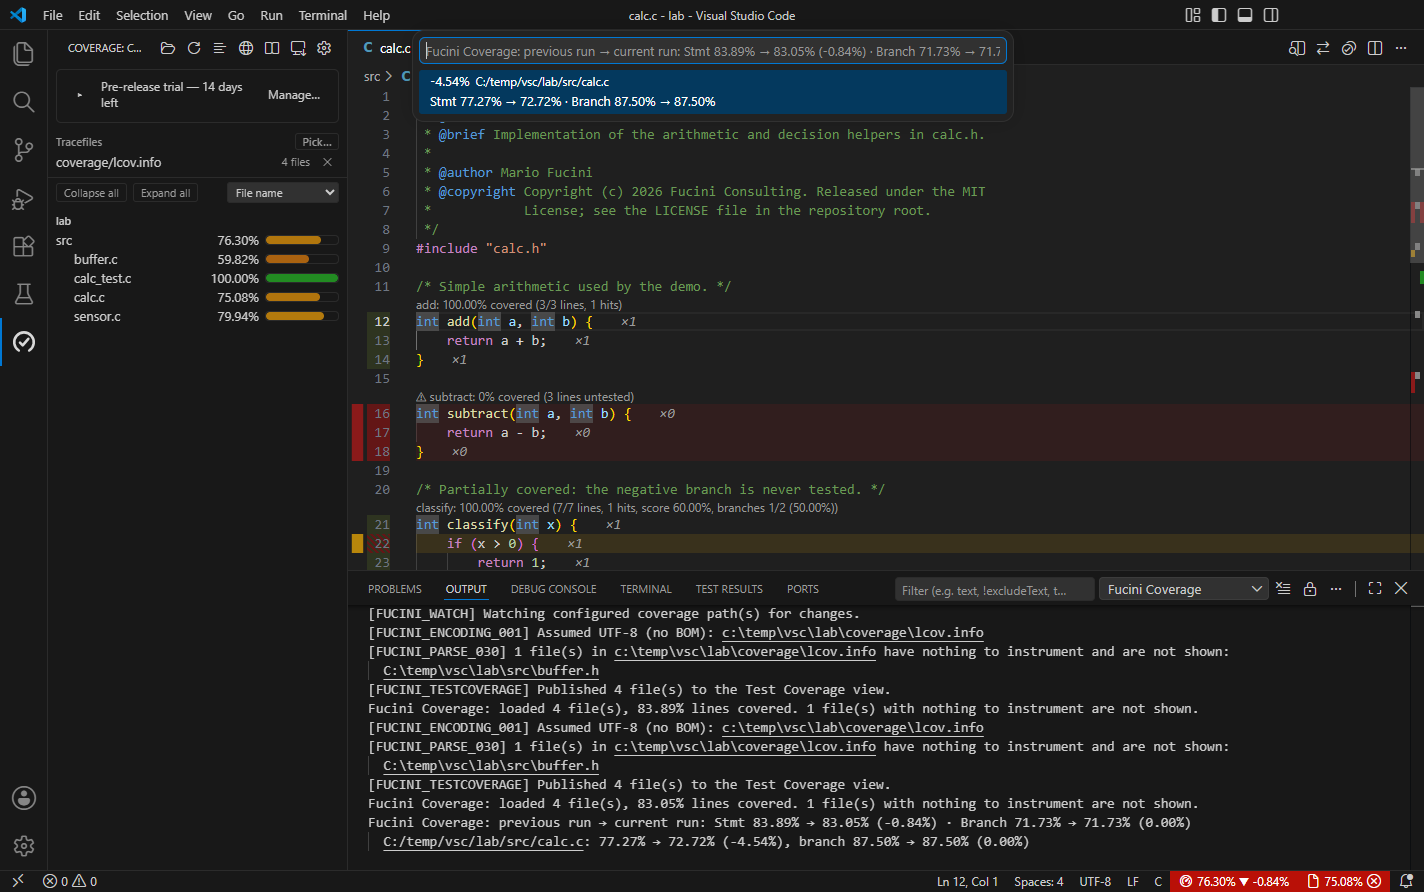 Screenshot pending — add assets/img/history-compare.png (see SCREENSHOTS.md).
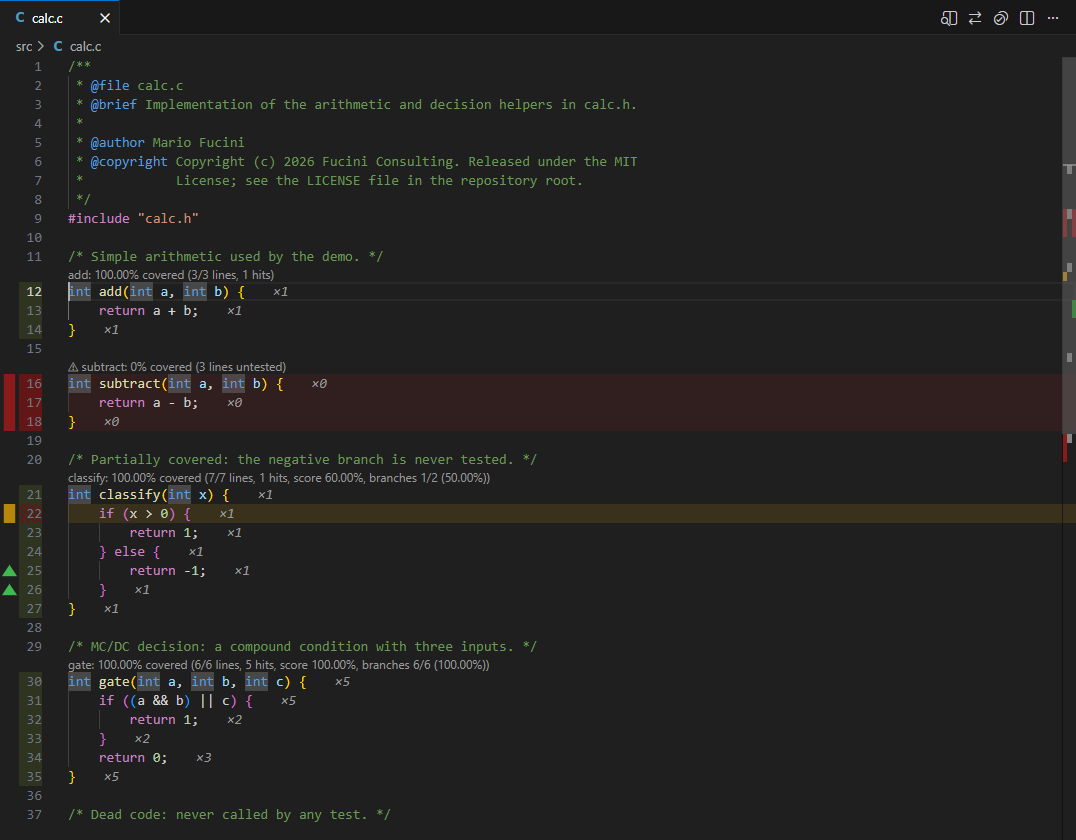 Screenshot pending — add assets/img/since-last-run.png (see SCREENSHOTS.md).
The trend chart
Under the toolbar of the Coverage view, with two saved runs or more, the history's line coverage as a line, oldest to newest, the newest thirty: a dot per run that says its date and figure on hover, and the last figure beside it with an arrow for the direction since the first. The vertical scale is the runs' own range, so a team at 92–94% sees the movement rather than a flat line under 100. Both editions draw it from the same history.
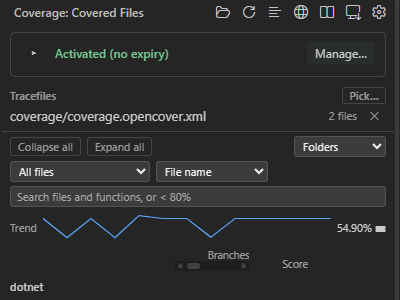 Screenshot pending — add assets/img/trend-chart.png (see SCREENSHOTS.md).
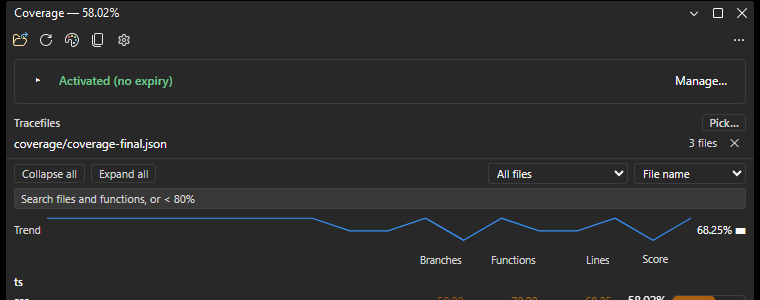
Coverage sessions
One test run rarely covers everything a change touched: the unit tests ran here, the integration suite there, a walk through the UI with coverage on somewhere else. Start Coverage Session turns the loads that follow into one sum — each run is added to the one before it line by line as a union, a line any of them executed is covered and the counts add up — so the gutter, the tree and the score show what they all reached together. The run on screen, if there is one, is the session's first. A bar over the tree says how many runs since when and ends the session; End Coverage Session does the same, and the next load stands alone again. In Visual Studio one entry under Tools → Coverage Studio starts the session and, checked, ends it.
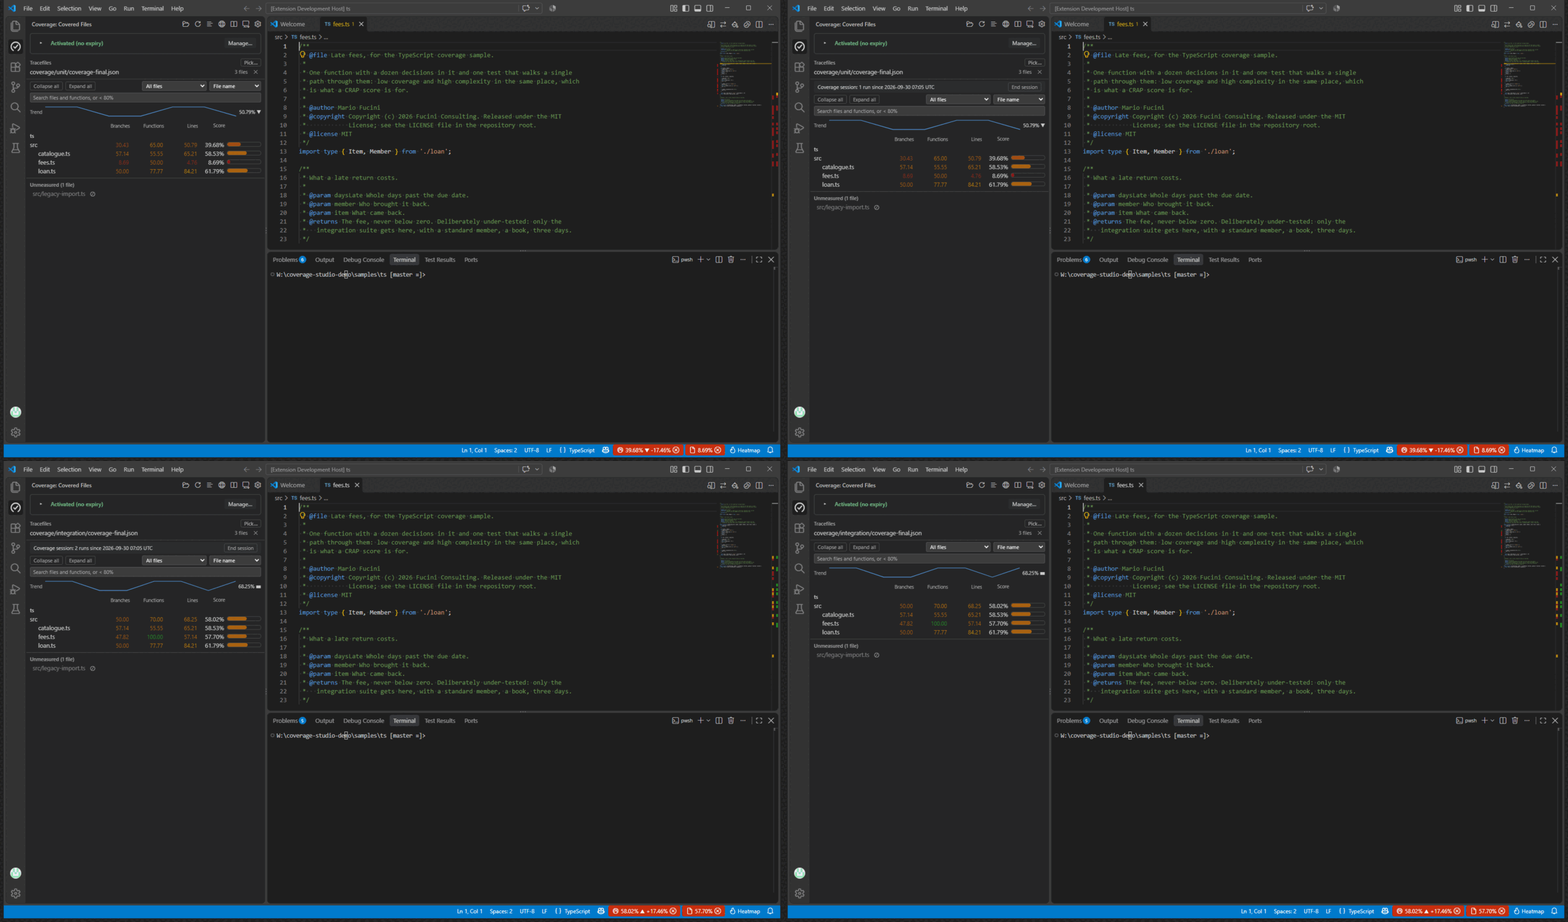 Screenshot pending — add assets/img/coverage-session.gif (see SCREENSHOTS.md).
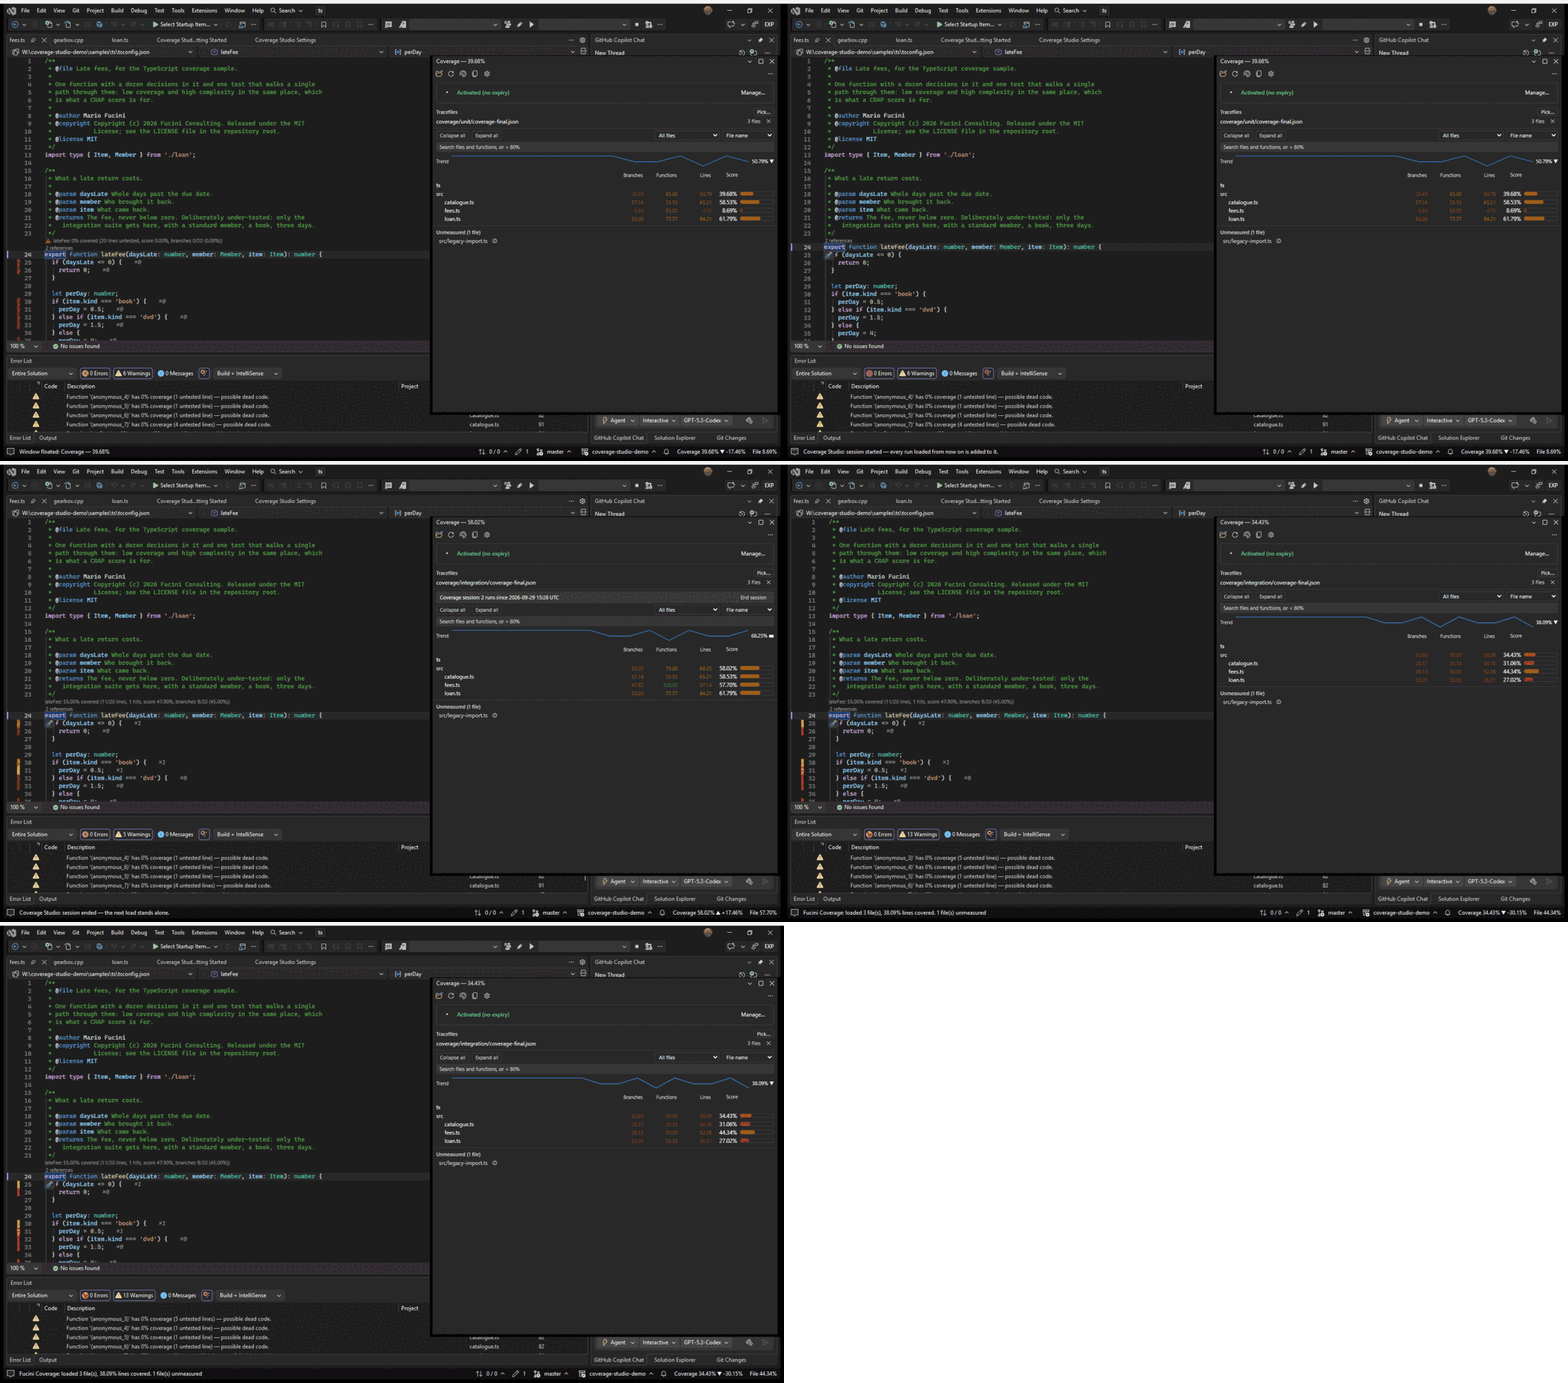
The CI baseline: where am I against main?
Compare with Last Run answers what your last change did; before a pull request the question is where you stand against main, and the answer is on the build server. baseline.report names the report the main branch's build publishes, and every load is held against it: the status bar's card carries the one-line delta — vs CI baseline: 84.20% → 85.10% (+0.90%), 3 file(s) moved — and Compare with CI Baseline lists the files that moved, file by file, in the same words as Compare with Last Run. In Visual Studio the command is under Tools → Coverage Studio and fetches or reads the report when you ask. Three ways to name it, in .vscode/settings.json:
- A URL the CI serves. GitLab keeps a branch's last job artifacts at a stable address; the token stays out of the settings file through
${env:…}inremote.headers. Jenkins:https://jenkins.example.com/job/app/job/main/lastSuccessfulBuild/artifact/coverage/lcov.info. TeamCity:https://tc.example.com/repository/download/App_Main/.lastSuccessful/coverage/lcov.infowithAuthorization: Bearer ${env:TC_TOKEN}. The URL is fetched and cached exactly as acoverageFile.pathsURL is (ETag,remote.refreshMinutes). - A file the pipeline copied onto a share — an absolute path such as
\\build\drops\app\main\coverage.cobertura.xml. - A downloaded artifact kept under the folder, say
ci/main.lcov.info(put the folder in.gitignore) — a path relative to the folder.
{
  "fuciniCoverage.baseline.report": "https://gitlab.example.com/api/v4/projects/42/jobs/artifacts/main/raw/coverage/lcov.info?job=test",
  "fuciniCoverage.remote.headers": ["PRIVATE-TOKEN: ${env:GITLAB_TOKEN}"]
}
Any format the reader knows will do. A path the CI wrote relative to its checkout — src/Billing/Invoice.cs, as Coverlet writes it on the runner — is placed under this folder before the diff, so it meets the file the local run resolved; an absolute path from another machine matches nothing, so have the pipeline write relative paths. A baseline that cannot be fetched or read is a line in the Output pane, never a failed load.
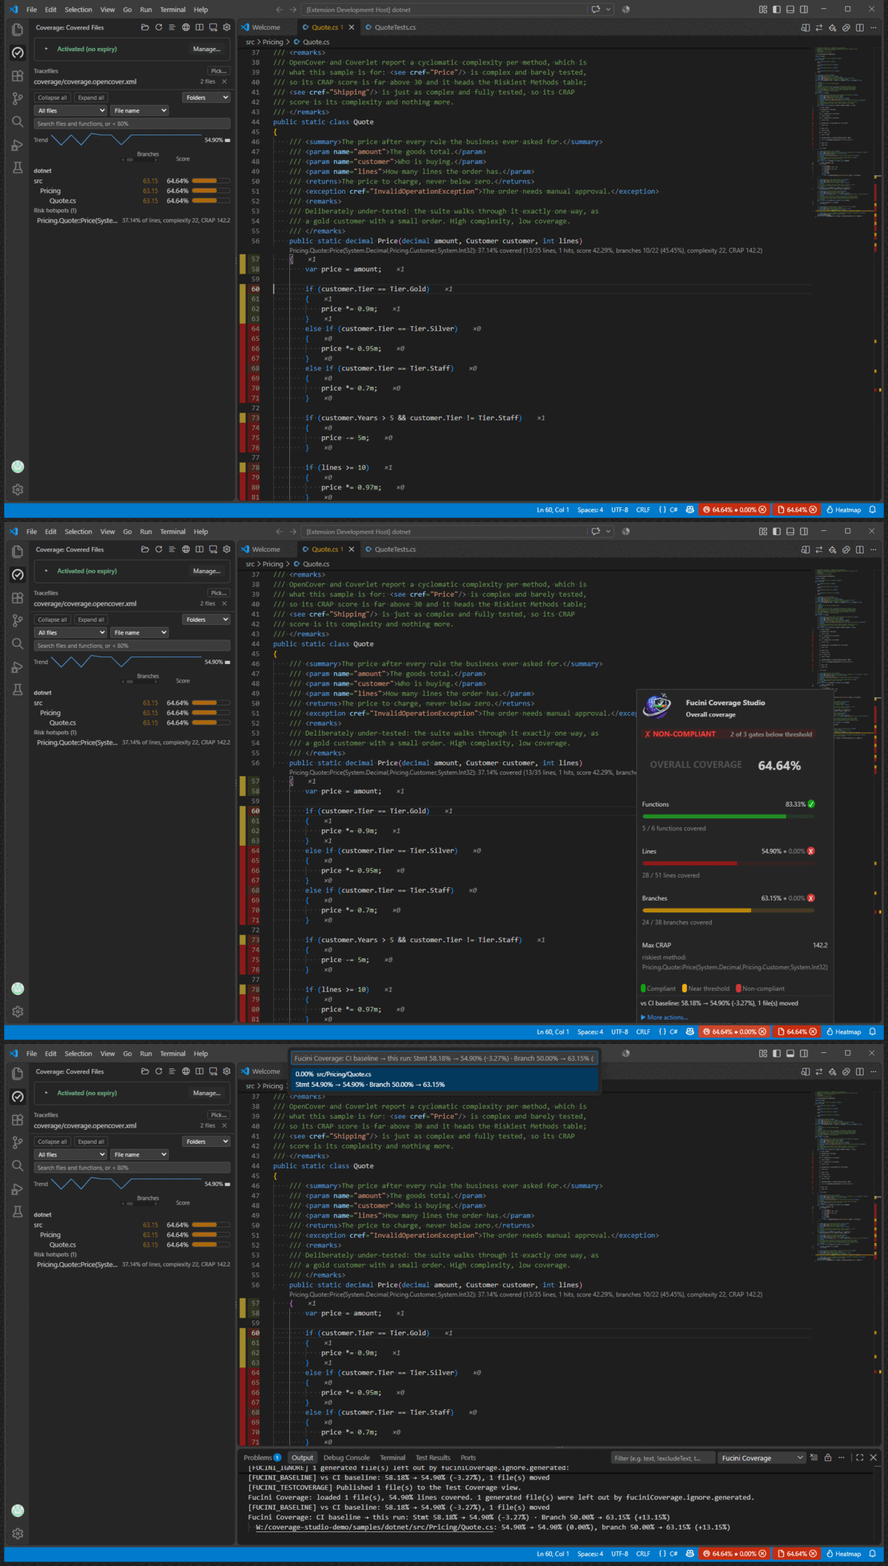 Screenshot pending — add assets/img/ci-baseline.gif (see SCREENSHOTS.md).
main.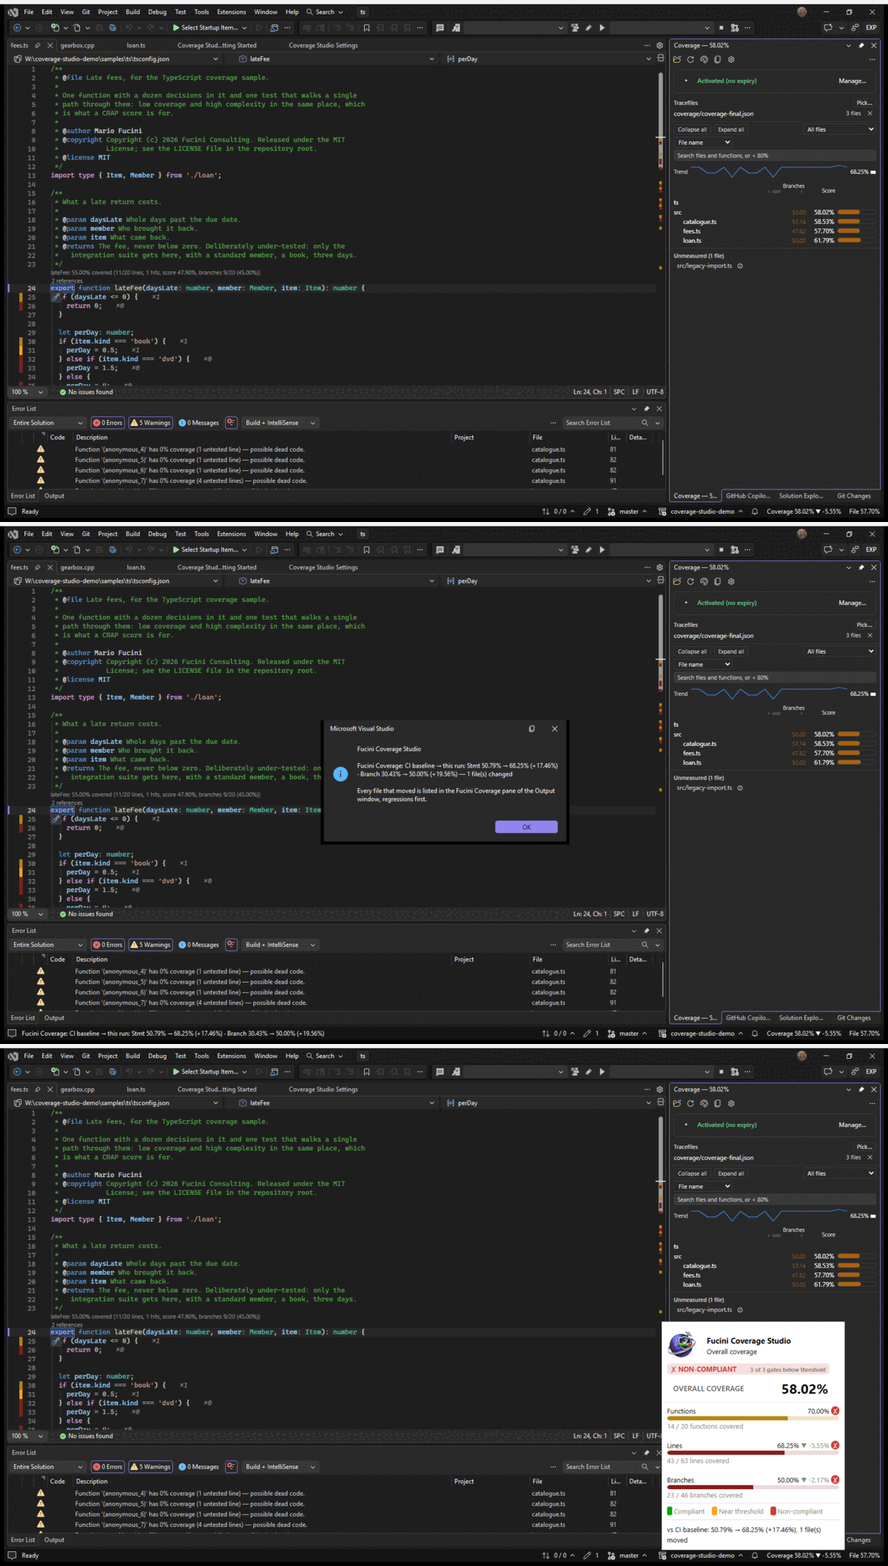
An artifact is a zip, and that is read too. GitHub and GitLab hand an artifact over as an archive, whatever was put in it. Name the report in it after a #: the member is found by its path or by the end of it; without a # it is the archive's only file, or its only file that looks like a report, and where there are several the output names them. The same goes for a zip you downloaded (ci/artifact.zip#lcov.info) and, in VS Code, for a URL in coverageFile.paths. The token goes to the server it was set for and no further: the redirect to the storage that holds the archive is followed without it.
{
  "fuciniCoverage.baseline.report": "https://api.github.com/repos/acme/app/actions/artifacts/1234567/zip#coverage/lcov.info",
  "fuciniCoverage.remote.headers": ["Authorization: Bearer ${env:GITHUB_TOKEN}"]
  }
14a. For AI agents: the coverage on screen
An agent that writes tests can run them and read a percentage. What it cannot do by itself is ask what the editor knows: which lines of this function never ran, which side of which branch, which tests reach a line, whether the diff it just wrote is covered. Six tools answer exactly that, in words an agent can act on, from the run that is loaded — the same exclusions, the same remapping, the same numbers as on screen. So an agent told to cover the gaps of a function, and a reviewer looking at the gutter, are talking about the same lines.
| Tool | What it answers |
|---|---|
coverage_summary | The run's totals per metric, and the files furthest from covered. The first thing to ask. |
coverage_gaps | What never ran in a file, a function or a range of lines: the uncovered lines, the branch arms not taken, the MC/DC conditions without their pair, the mutants that survived. |
tests_for_line | Which tests ran a line, where the report says — a per-test run. |
patch_coverage | The coverage of a diff — the working tree against a ref, or a patch handed over — and its lines that never ran. |
coverage_delta | What moved since the run before: the totals, and the files that gained or lost. |
test_run_command | The command that runs this workspace's tests with coverage on. The agent runs it; the editor reloads the report by itself. |
VS Code's own agent has them as tools with nothing to set up. Every other agent — any client that speaks MCP, the Model Context Protocol — reaches them through a server the editor runs when mcp.enabled is on, in VS Code and in Visual Studio alike. Copy MCP Server Configuration puts the client's entry on the clipboard, as VS Code and Visual Studio read it in an mcp.json; a client that names the outer key mcpServers takes the same entry under that name.
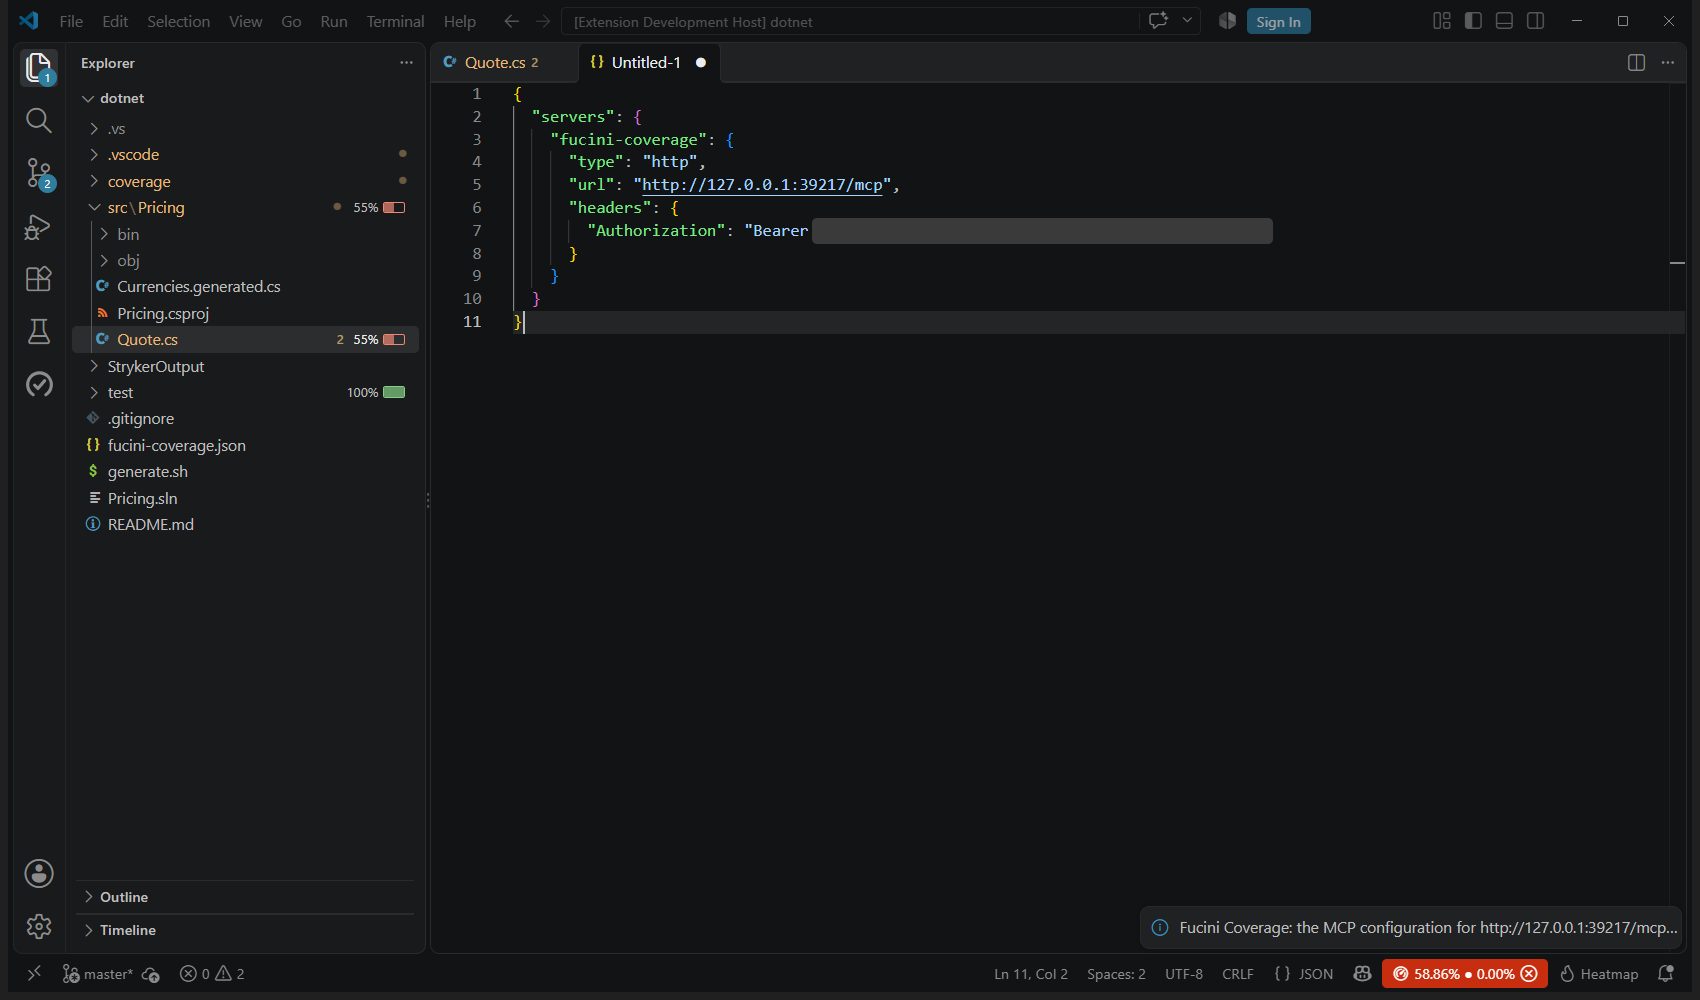 Screenshot pending — add assets/img/mcp-config.png (see SCREENSHOTS.md).
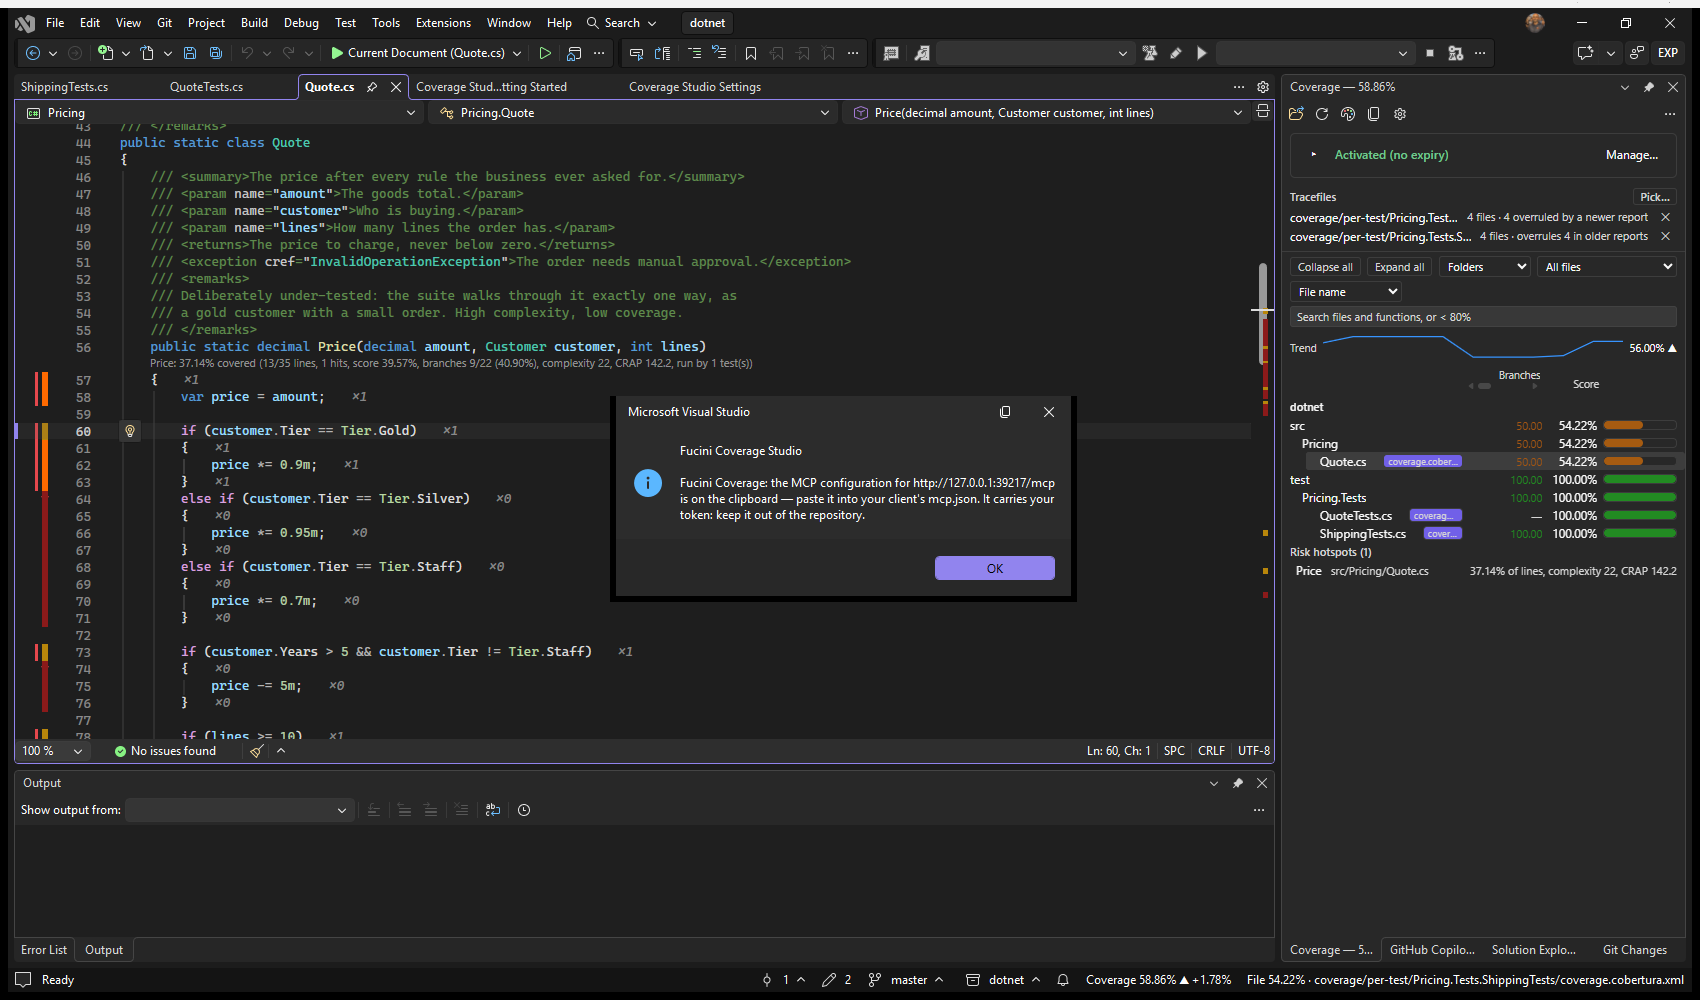 Screenshot pending — add assets/img/vs-mcp-config.png (see SCREENSHOTS.md).
{
  "servers": {
    "fucini-coverage": {
      "type": "http",
      "url": "http://127.0.0.1:39217/mcp",
      "headers": { "Authorization": "Bearer …" }
    }
  }
}- It is off unless you turn it on, and it listens on
127.0.0.1only: nothing off this machine reaches it. - A call has to carry your token, made once and kept for you; without it the answer is 401. The copied configuration carries the token: keep it out of the repository.
- A call a web page sent — it says so in its
Origin— is refused, whatever it carries. - It reads the run that is loaded and writes nothing. The test run is named, not started: the agent runs the command in its own terminal.
The port is mcp.port, 39217 unless set. Where that is taken — a second window, the other edition beside this one — the next free one is used, and the copied configuration names the one that works. The output says where the server listens ([FUCINI_MCP]) and why it could not ([FUCINI_MCP_001]). What a plan does not include — the names of tests, MC/DC detail — the tools count without spelling it out, as the hover does.
15. Command reference
In Visual Studio. Every command is under Tools → Coverage Studio, named as in the table without the Fucini Coverage: prefix; the Coverage window's toolbar and the right-click menu on a row have the ones that belong there, and the code window's right-click menu has the three that act on the editor: Run This Test with Coverage, Show Tests That Ran This Line and Exclude Selection from Coverage. Those with keys are two-stroke chords after Ctrl+Shift+U: R reloads, N and P go to the next and the previous uncovered line, B to the next partly-tested decision, T lists the tests that ran the line, X excludes the selection — not VS Code's Alt+N, because in Visual Studio Alt and a letter opens a menu. Change them under Tools → Options → Keyboard, where they are listed as Coverage Studio: …. Not in this edition: the Test Coverage panel is a VS Code API — the run is in the Coverage window instead — and Solution Explorer cannot show badges. Only in this edition: Run Native Project with Coverage, for a C++ startup project.
In Visual Studio: where everything is. The Coverage window is under View → Other Windows → Coverage, and first in Tools → Coverage Studio, where every command of this edition sits, in groups: loading and reloading, watching the file, the two copies and the cards; Run Tests with Coverage, Run Native Project with Coverage and Collect Coverage in Test Explorer…; Next and Previous Uncovered and the partly-tested decisions; painting, hit counts and the gutter modes; the coverage source of a file, the tests that ran a line, one test with coverage, the two ways to exclude; Compare with Last Run, Compare Two History Runs…, Compare with CI Baseline, the coverage session and Check Coverage Thresholds; the Reports group — Show Annotated Source, Open HTML Report, Generate Full HTML Report, Export Coverage Report… and Generate Coverage Badge; then Getting Started, the compliance thresholds and Licence…. The window's own toolbar has the five you reach for most: Load Coverage, Reload, Toggle Coverage Painting, Copy Coverage Summary and the compliance thresholds; under them the perspective, the filter and the sort, and the search box; under those the trend. Rest the pointer on a row of the tree and press its ⋯ for the row's menu — open the file, open its folder, copy its path, absolute or relative, with either kind of slash, exclude it from coverage. At the right end of the status bar are the run's score and the open file's, with the trend since the last run; Show Coverage Card and Show Coverage Card for This File open the cards behind them, the same cards VS Code shows when the pointer rests on its status-bar item.
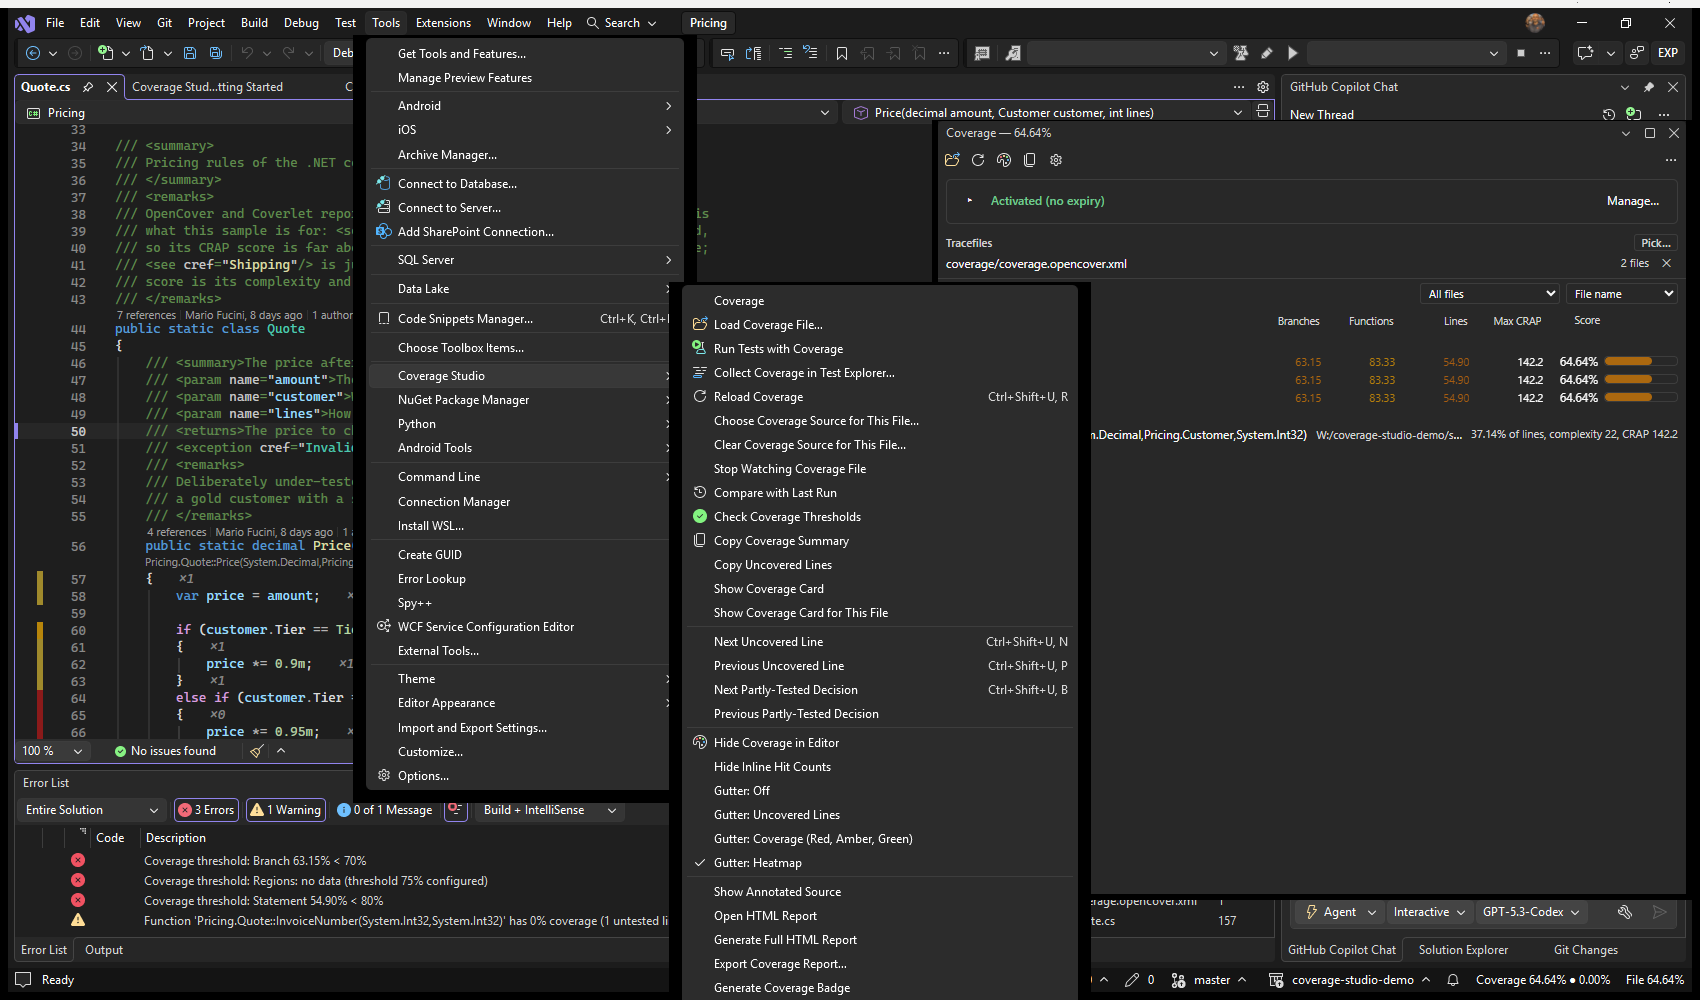
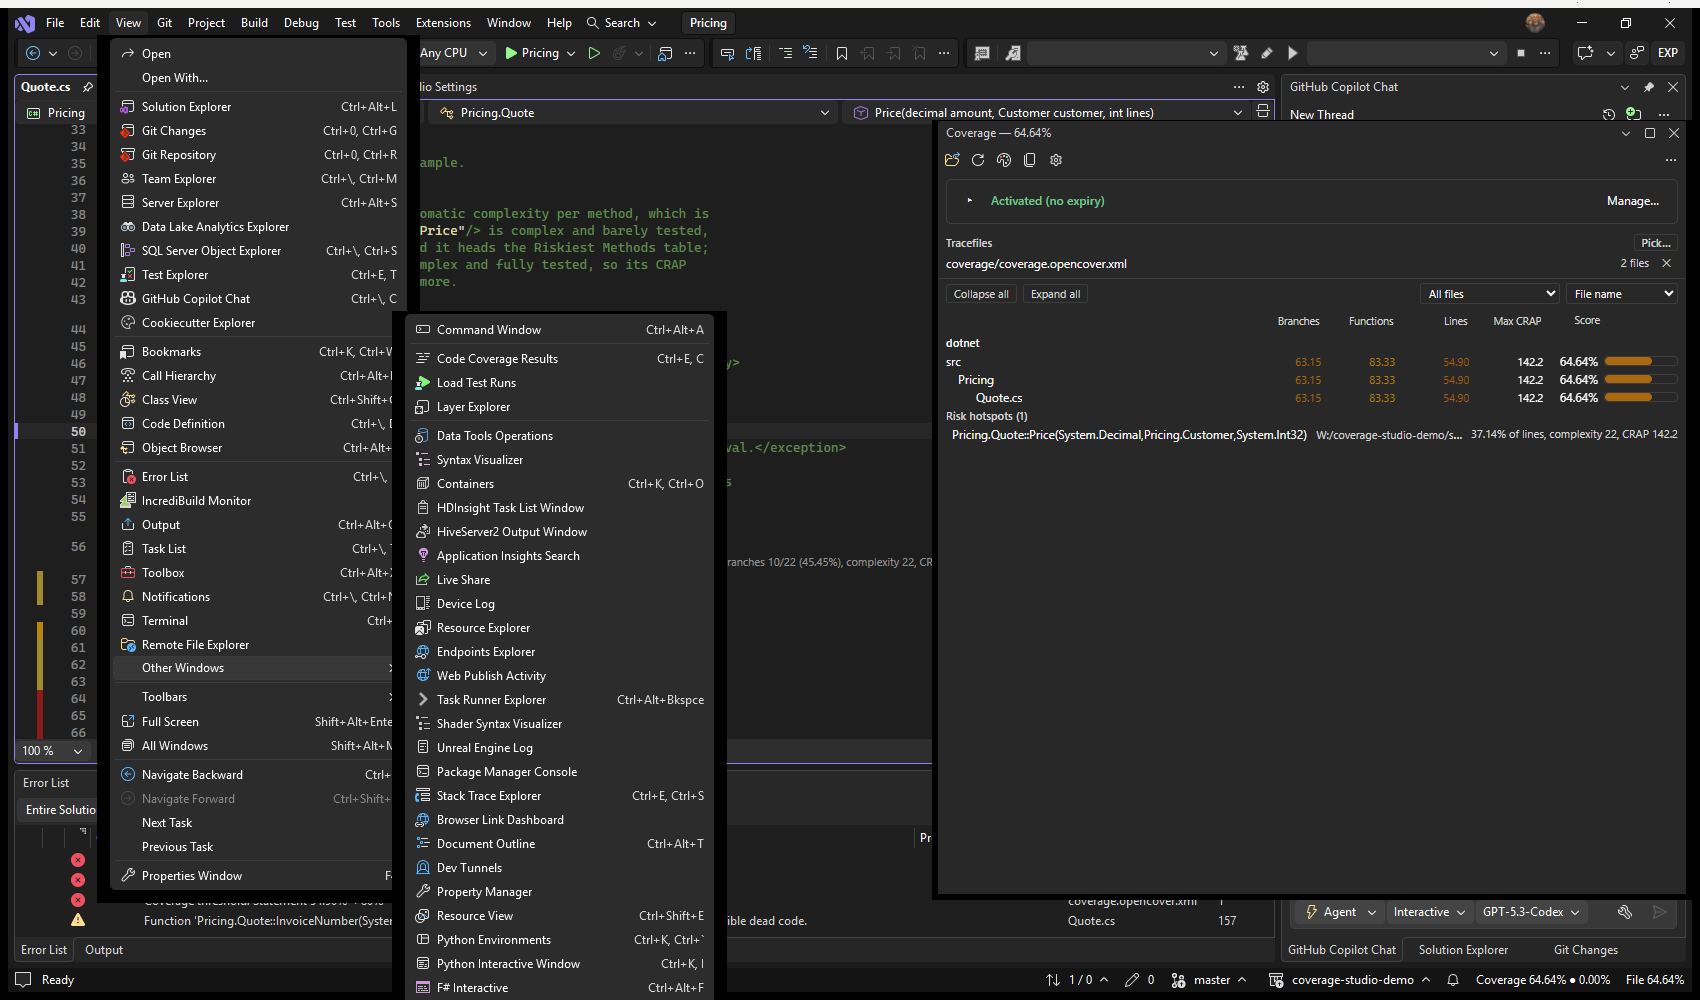

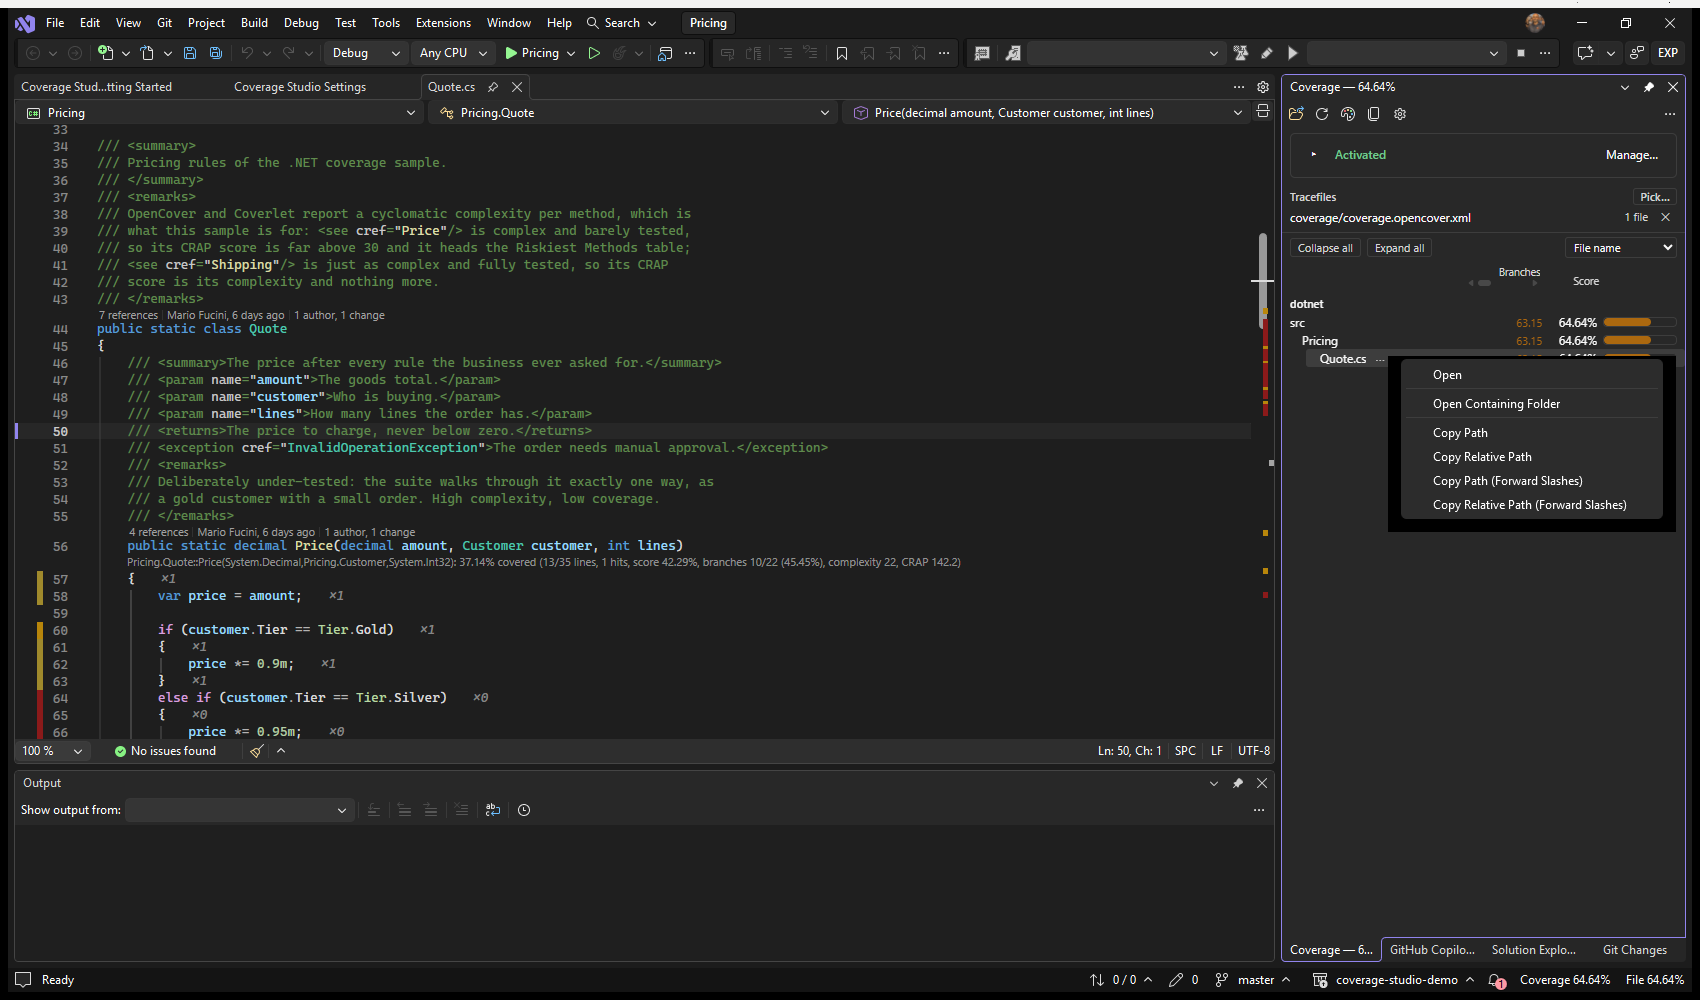


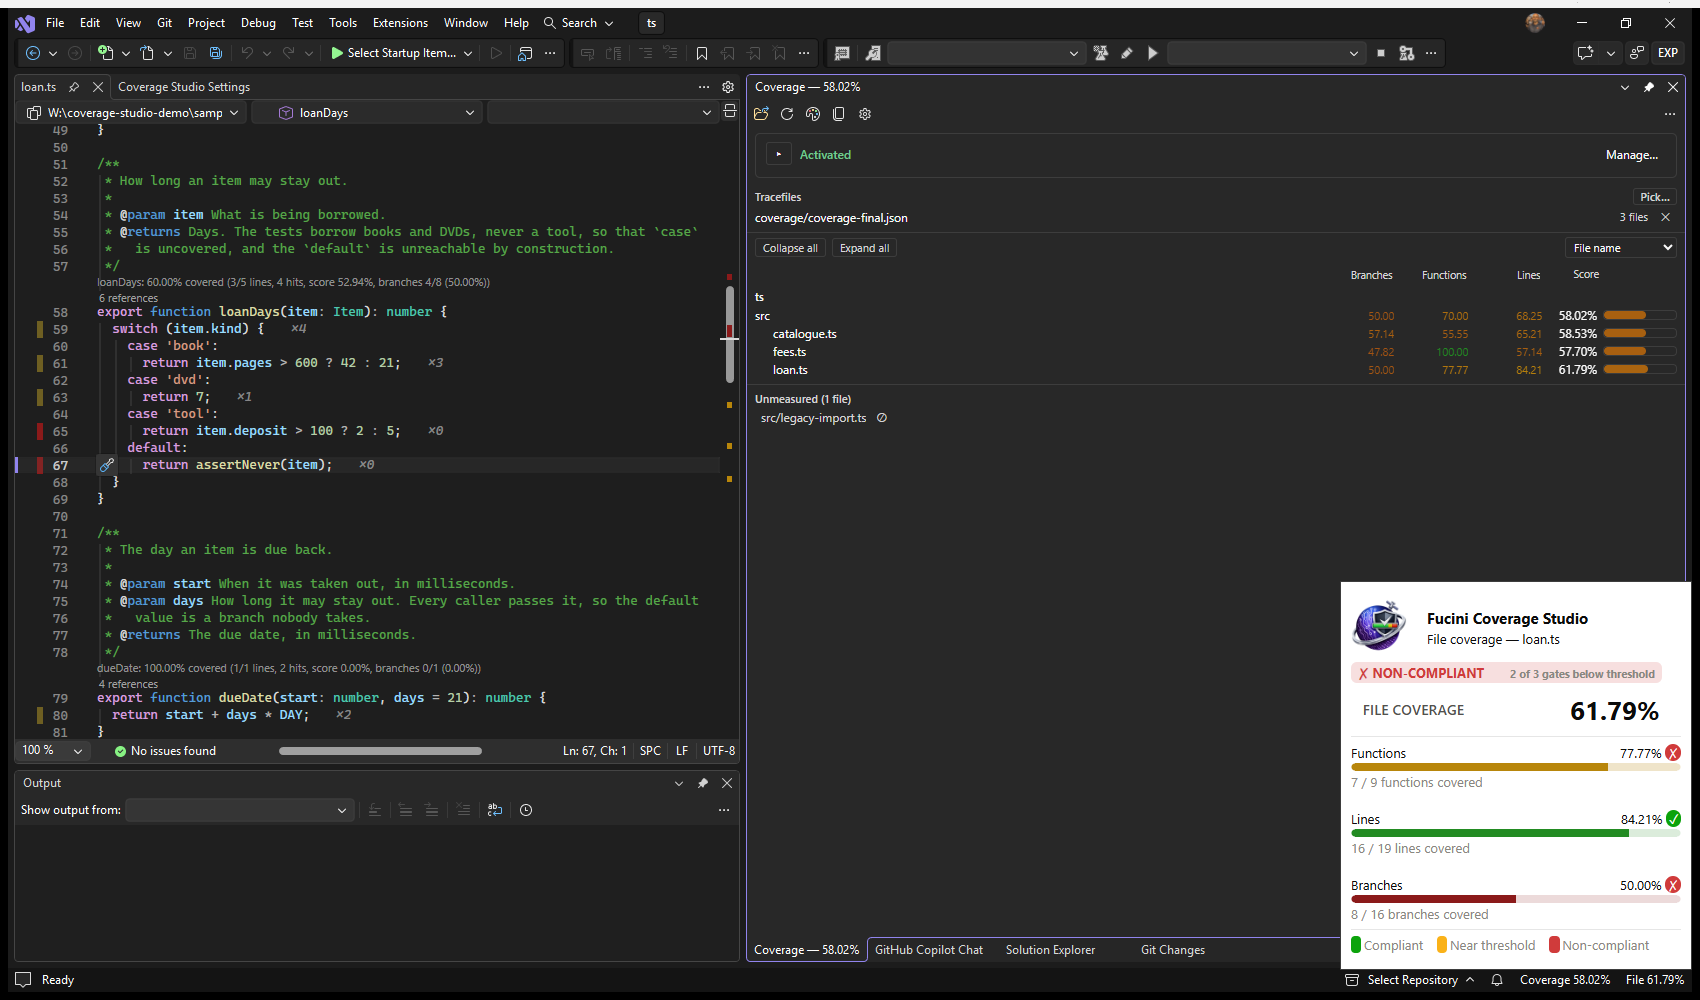
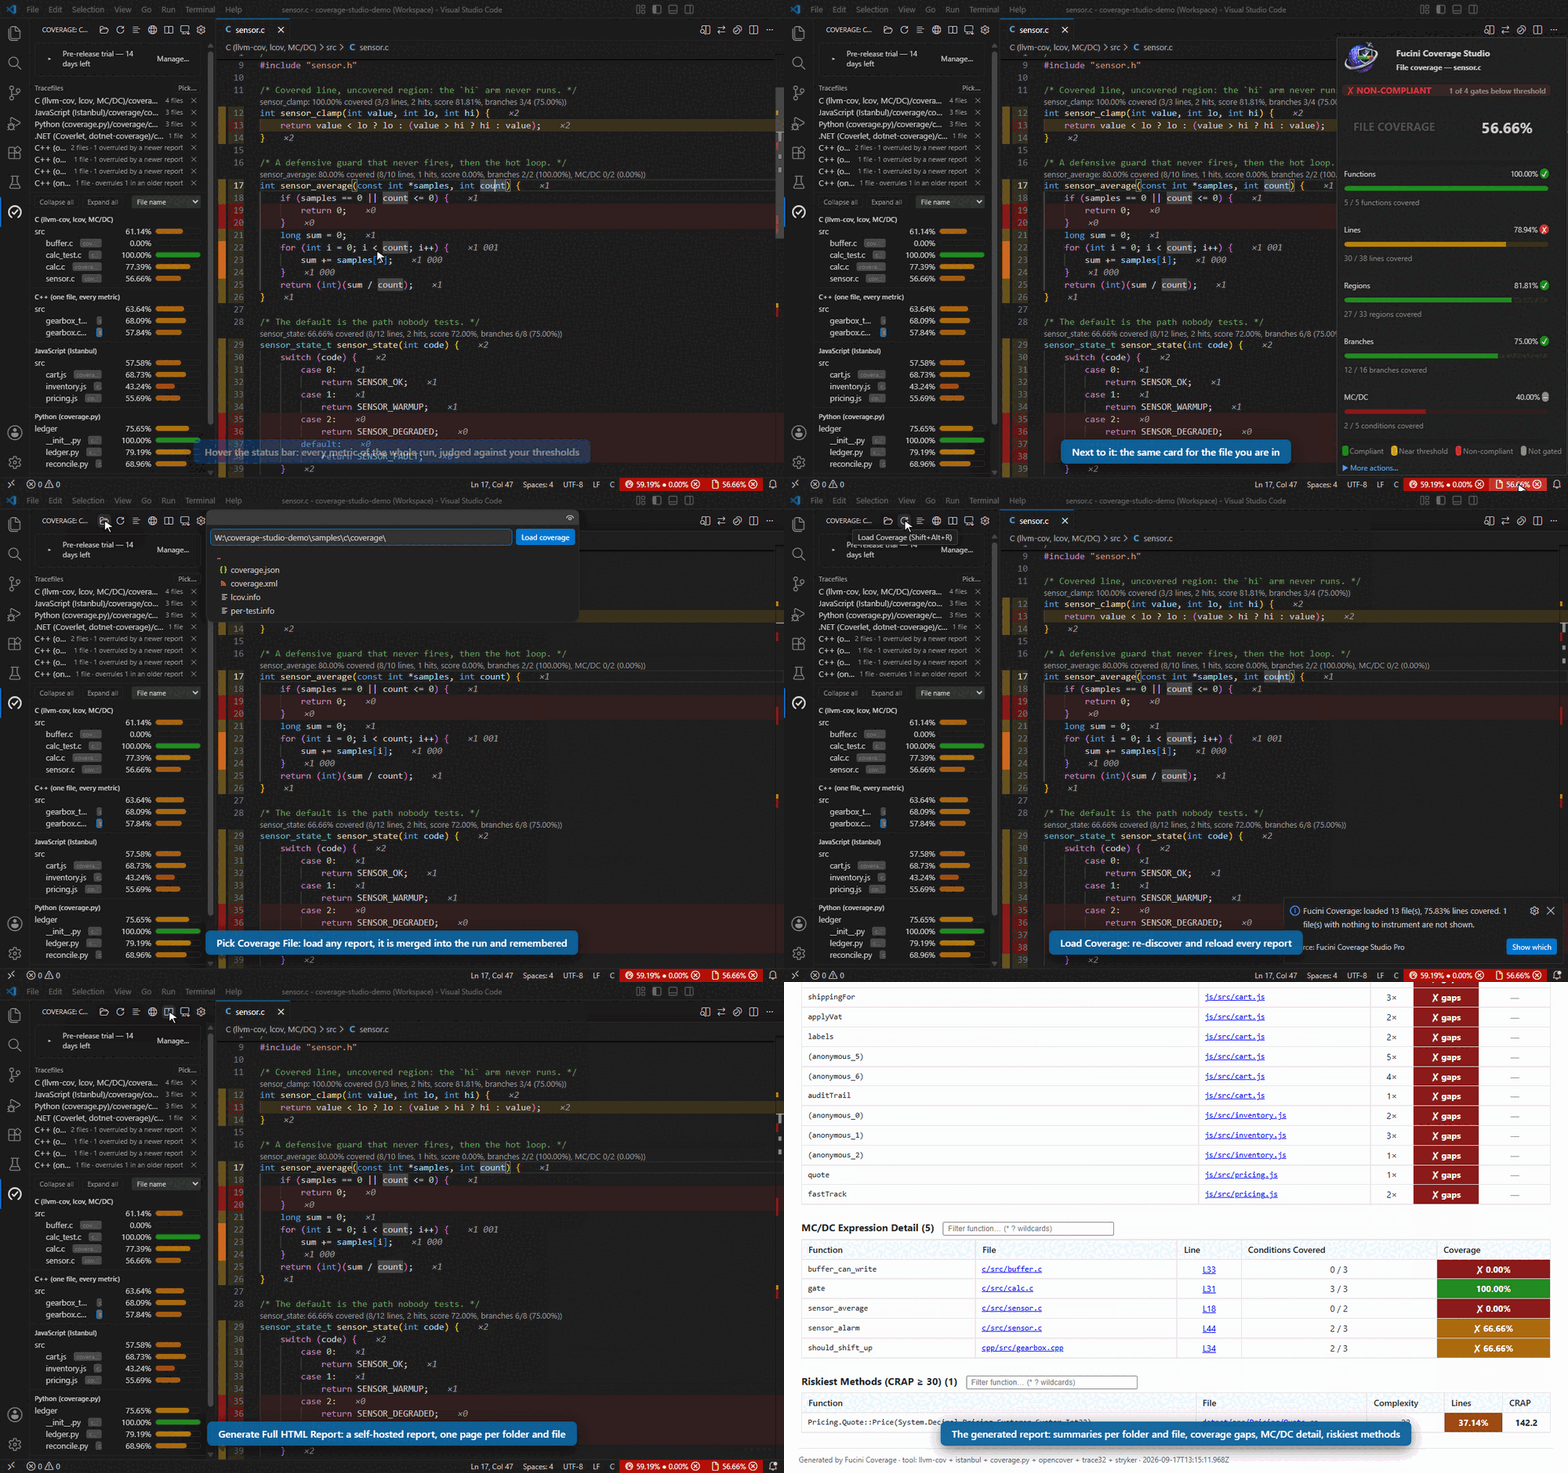 Screenshot pending — add assets/img/statusbar-and-toolbar.gif (see SCREENSHOTS.md).
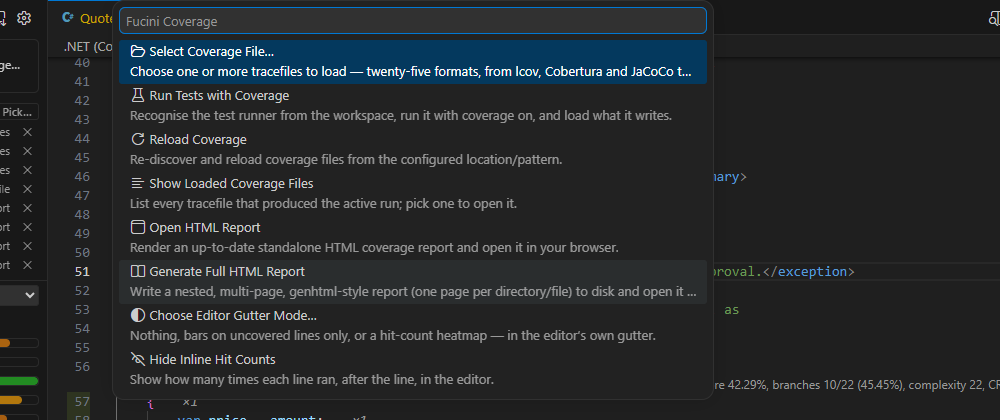 Screenshot pending — add assets/img/statusbar-menu.png (see SCREENSHOTS.md).
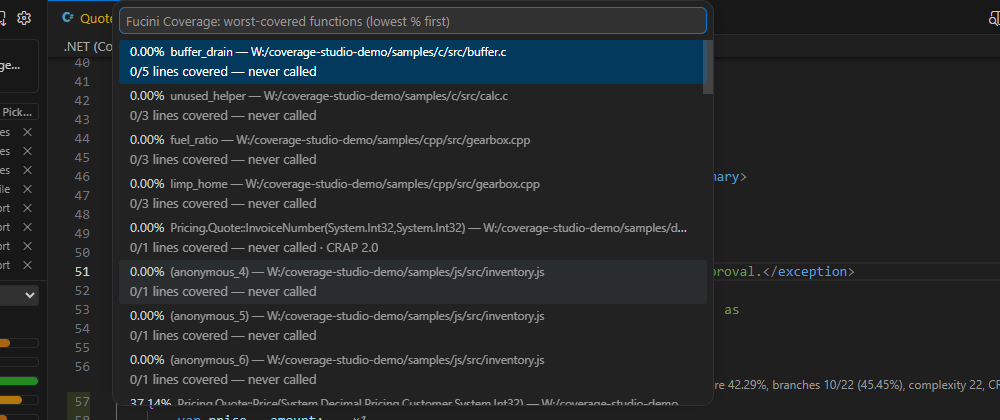 Screenshot pending — add assets/img/worst-functions.png (see SCREENSHOTS.md).
| Command | What it does |
|---|---|
| Load Coverage | Discover & load coverage for the workspace. Alt+Shift+R by default (Ctrl+Alt+R on macOS). |
| Pick Coverage File | Choose tracefiles — one, several, or a further one each time; picks add up, are merged, and are written to coverageFile.paths so they load by themselves from then on. |
| Show Loaded Coverage Files | List the tracefiles in the active run. The Coverage view lists them too, each with an unload button and a pick button beside them. |
| Toggle Tracefile Watch | Watch the tracefile(s) for changes and reload automatically. |
| Run Tests with Coverage | Recognise the test runner, run it with coverage on in a terminal task, load what it writes, and offer to add the path to the settings. |
| Run This Test with Coverage | The test under the caret — the method, the class or describe block, or the file — run by the recipe narrowed to it, then loaded like any run. Also on the editor's context menu. |
| Show Tests That Ran This Line | Where the report says which tests ran what, list the tests that ran the line under the caret, busiest first, and open the one you pick where it is written. |
| Run Tests Affected by My Changes… | List the tests that ran a line the working tree changes against testImpact.baseRef, open the one you pick, or run only those where the reports came from a per-test run. |
| Show Minimal Test Set… | The fewest tests that still run every line the suite runs, then the tests that add no line of their own. |
| Run App with Coverage… | Start the folder's .NET app under dotnet-coverage, and load what you walked through when it closes. |
| Run Mutation Tests Here | Mutate the function the caret is in — or the selection, or the file — with Stryker.NET, StrykerJS or PIT, and load the report beside the coverage on screen. |
| Exclude This File from Coverage / Exclude from Coverage | Put the open file — or, on a row of the Coverage view, the file or the folder's /** — into fuciniCoverage.ignore in the folder's settings, once. |
| Exclude Selection from Coverage | Write the exclusion where the code is: [ExcludeFromCodeCoverage] above a .NET member, LCOV_EXCL_LINE on one line, LCOV_EXCL_START/STOP around several, in the file's own comment sign. Also the light bulb and the editor's context menu. |
| Start Coverage Session / End Coverage Session | While a session is on, every load is added to the one before it as a union; a bar over the tree counts the runs and ends it. |
| Next / Previous Uncovered | Jump between uncovered regions. Alt+N / Alt+P by default (Ctrl+Alt+N / Ctrl+Alt+P on macOS). |
| Choose Editor Gutter Mode... | Off, uncovered-only bars, red-amber-green bars, or a hit-count heatmap in the editor's gutter. |
| Cycle Editor Gutter Mode | One step on through off, uncovered, coverage and heatmap — Alt+G, or the mode button in the status bar. |
| Choose Coverage Source for This File... | When more than one loaded report measures the open file, choose which one its numbers come from, for the file, its folder or a pattern — writes a coverageFile.sources rule. |
| Clear Coverage Source for This File... | Take out the coverageFile.sources rules that apply to the open file. |
| Toggle Inline Hit Counts | Show or hide the ×N execution counts after each line — flips hitCounts.inline. |
| Show in Test Coverage View | Publish the active run to VS Code's own Test Coverage panel (even with testCoverage.publish off) and open it. |
| Suggest Path Remap Rule | Infer the pathRemap rule that would match the active run's unmatched files to the workspace, and offer to add it. |
| What Community Includes | Every cap and withheld feature of the free tier in one list, with how much of each cap is used. |
| Open HTML Report | Open the rendered static report. |
| Generate Full HTML Report | Build the multi-page report. |
| Open Annotated Source / …to the Side | Annotated coverage view for a file. |
| Toggle Annotated Source | Swap between source and annotated view. Alt+A by default (Ctrl+Alt+A on macOS). |
| Show Worst-Covered Files / Folders / Functions | Ranked lowest-first Quick Pick. |
| Copy Uncovered Lines | Markdown summary of every uncovered range. |
| Compare Two History Runs / with Last Run | Per-file regression diff — two runs the history kept, or the run on screen against the one it replaced. |
| Compare with CI Baseline | The loaded run against the report baseline.report names — the main branch's from CI, a URL or a downloaded artifact — file by file. |
| Show Indirect Coverage Changes… | The lines whose coverage moved though nobody edited them, against the CI baseline or the run before, per file. |
| Check Coverage Thresholds | Evaluate the compliance gates. |
| Export Fucini JSON | Export the current run as Fucini JSON. |
| Export Coverage Report... | Pick a format — CSV, Markdown, LCOV, Cobertura XML, SARIF or an SVG badge — and a destination. |
| Generate Coverage Badge | Write the SVG badge for the active run to badge.outputPath, showing badge.metric, and offer to open it. |
| Copy MCP Server Configuration | Put what an MCP client needs to ask about the coverage on screen — the server's address and your token — on the clipboard; with the server off, offer to turn it on. |
| Show Status Bar Menu | Open the quick-action menu. |
| Browse for External HTML Report / Full Report Output Dir… | Set the report directories via a picker. |
16. Settings reference
The complete, categorised settings table — every option with its default — lives on the Features & Settings page. All keys are prefixed fuciniCoverage..
Worth calling out: fuciniCoverage.language pins this extension's own runtime UI (status bar, notifications, tooltips, webviews) to a specific language, independent of VS Code's Display Language — it defaults to auto and ships bundles for all 18 supported languages. It does not change Command Palette entries or the Settings UI labels, which VS Code resolves from its own Display Language.
In Visual Studio. The same fuciniCoverage.* keys, read from up to four files, the later winning: VS Code's own user settings if VS Code is on the machine — read, never written, so your colours and thresholds come along; %APPDATA%\Fucini\CoverageStudio\settings.json, this edition's user settings; .vscode\settings.json in the folder or beside the solution, so a repository set up for VS Code is set up for Visual Studio; and fucini-coverage.json at the solution root, for a team that would rather not keep a .vscode folder in a .NET repository — the VS Code edition reads it too. The gear in the Coverage window's toolbar opens a settings window that writes the user file or the folder's file that exists, as its Write changes to selector says, and keeps the comments of a file it edits. fuciniCoverage.language works there in the same way; the menus follow Visual Studio's own language.
17. Error codes
Diagnostics go to the Fucini Coverage output channel (View → Output → Fucini Coverage), each with a stable FUCINI_* code.
In Visual Studio. The same codes go to the Fucini Coverage pane of the Output window (View → Output) and are kept in %LOCALAPPDATA%\Fucini\CoverageStudio\coverage-studio.log, for the question that arrives after the IDE is closed. Three that come up: nothing is marked although the pane says files were loaded — the gutter mode is off, choose Show Coverage in Editor; FUCINI_REMAP_001 and an information bar — the report names paths that do not exist here, and the pane suggests the pathRemap rule; the Coverage window says it needs WebView2 — install the Microsoft Edge WebView2 Runtime, the marks in the editor do not need it.
| Code | Meaning |
|---|---|
FUCINI_PARSE_001 | Unsupported/unrecognised coverage format — no parser matched the file. |
FUCINI_PARSE_010 | lcov file had no SF records. |
FUCINI_PARSE_020 | llvm-cov JSON invalid, missing data[], or contained no files. |
FUCINI_PARSE_030 | Cobertura root <coverage> missing or XML invalid. |
FUCINI_PARSE_040 | JaCoCo root <report> missing or no source files. |
FUCINI_PARSE_050 | Istanbul/SimpleCov JSON invalid or contained no files. |
FUCINI_PARSE_060 | SimpleCov JSON invalid or missing a top-level files array. |
FUCINI_PARSE_070 | Go profile with no mode: header, or no coverage blocks in it. |
FUCINI_PARSE_080 | Clover root <coverage> or <project> missing, or no files in it. |
FUCINI_PARSE_090 | OpenCover root <CoverageSession> missing, or no files in it. |
FUCINI_PARSE_100 | coverage.py JSON invalid or missing a top-level files object. |
FUCINI_PARSE_110 | gcov/gcovr JSON invalid or missing a top-level files array. |
FUCINI_PARSE_120 | GNATcoverage XML with no <source> element, or an index.xml whose xi:includes were never resolved — load the per-source *.xml files instead. |
FUCINI_PARSE_130 | BullseyeCoverage root <BullseyeCoverage> missing, or no <src> elements in it. |
FUCINI_PARSE_140 | Visual Studio coverage root <CoverageDSPriv> missing, no <SourceFileNames> table to resolve line rows against, or no line data in it. |
FUCINI_PARSE_150 | Xcode coverage JSON invalid, or missing a top-level targets array. |
FUCINI_PARSE_160 | SonarQube generic coverage root <coverage> missing, or no <file> elements in it. |
FUCINI_PARSE_170 | Coveralls JSON invalid, or missing a top-level source_files array. |
FUCINI_LOAD | A load was cancelled from its progress notification; the previous run, if any, stays loaded. |
FUCINI_REMOTE_001 | A coverageFile.paths URL could not be fetched, with the reason; the last downloaded copy is loaded instead. Plain [FUCINI_REMOTE] lines record each download and each unchanged (304) check. |
FUCINI_REMOTE_002 | A coverageFile.paths URL gave no complete answer within 30 seconds — most often a proxy or VPN that accepts the connection and then says nothing; the last downloaded copy is loaded instead. |
FUCINI_REMOTE_003 | A coverageFile.paths URL answered with an HTML page rather than a tracefile — a sign-in gateway, most likely. The page is not cached and the last downloaded copy is loaded instead; check the token in remote.headers. |
FUCINI_REMAP_002 | A pathRemap rule was suggested for the paths a load left unmatched, with how many of them it explains — or none could be inferred, or the inferred rule is already in the setting and did not resolve them. |
FUCINI_REMAP_003 | The suggested rule was appended to fuciniCoverage.pathRemap by Apply Suggested Remap and the coverage is being reloaded. |
FUCINI_GITDIFF_001 | The Git extension is unavailable, so diff coverage is skipped and the whole run is shown. |
FUCINI_GITDIFF_002 | gitDiff.baseRef begins with -, which no git ref can (git would read it as an option); diff coverage is skipped and the whole run is shown. |
FUCINI_IGNORE | How many files fuciniCoverage.ignore left out of the run, and which. |
FUCINI_UNMEASURED_001 | The files of the run's kind that no test loaded, one per line. |
FUCINI_UNMEASURED_002 | More than 5,000 workspace files matched one of the run's extensions; only the first 5,000 were considered for the Unmeasured list. |
FUCINI_UNMEASURED_003 | In count mode, some unmeasured files are listed but not counted: the read cap (2,000 files or 50 MB per load) was reached. |
FUCINI_UNMEASURED_004 | An unmeasured file could not be read; it is listed but not counted. |
FUCINI_MISSING_001 | With missingSources.includeInTotals off: how many files the report names are not on disk and were left out, one per line. |
FUCINI_TESTCOVERAGE | How many files were published to VS Code's Test Coverage view. |
FUCINI_BADGE | The badge was written, with its path, label and value. |
FUCINI_BADGE_001 | The badge could not be written, with the reason. |
FUCINI_WORKSPACE | A folder was added to or removed from the workspace; coverage is discovered again. |
FUCINI_VARIABLES | What each ${command:…} in the path settings answered, or why it was left as written: the command failed, answered with nothing usable, or the workspace is not trusted. |
FUCINI_WATCH | What the watcher is doing: the paths being watched, a configured file that has appeared, a task named in watch.reloadAfterTasks that ended (with its exit code) and triggered a reload, or a path under files.watcherExclude that is polled instead. |
18. Privacy
Telemetry is controlled by the window-scoped telemetry.enabled setting. It defaults off. The daily summary and the removal notice also need VS Code's global telemetry.telemetryLevel to allow telemetry; the install ping and a few small lifecycle events are sent regardless, and so is the usage ledger entry of an install on the trial or the free Community tier. On Community, Unlock Full Features trades this telemetry for every Pro feature, MC/DC included, for 30 days, once per machine — turn it off again and the standard Community set applies; a paid licence is unaffected either way. See the privacy policy for what is sent.
Two things are worth knowing because you can act on them. The first is your usage ledger ID: on the trial and on Community, the extension shows it under Show License / Activation and at the bottom of What Community Includes, where selecting the row copies it and opens the policy. The ledger knows your machine by a hash and by nothing else, so that ID is the only way to ask what it holds for you, have it deleted, or object to it — quote it and we can find your row; without it we cannot. The second is the install record: one row written the first time an install reports and kept rather than deleted after 90 days, holding the install identifier, the day, the place its address resolved to, the versions and the operating system — not the address, and nothing about your code. It is what lets us say how many installs there have been over the years. Both are described in full in the privacy policy, and both are deleted if you ask.
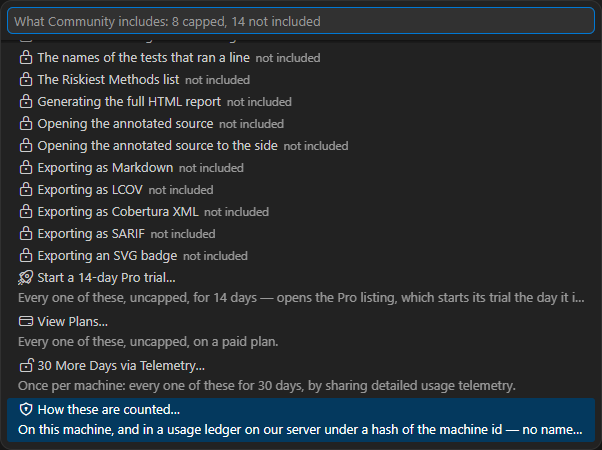
19. Evaluation & activation
Fucini Coverage Studio is distributed as an evaluation pre-release. On first run you're asked to agree to evaluate it, and the trial begins — every feature is available during a 14-day trial, counted from the first time you use it on that install. There is no fixed date after which anything stops.
From version 2.2026.2 the trial of a new install begins as soon as the extension has reached the licence server once; until then it runs on the Community tier and says so. In a development container or a Codespace no trial begins — a subscription code, a key or the 7-day pass unlocks the full set there.
When the trial ends nothing is locked out: the extension settles onto the free Community tier. To get the full set back, activate — activation connects to the license server and applies the returned key automatically, with no email and no key to copy by hand:
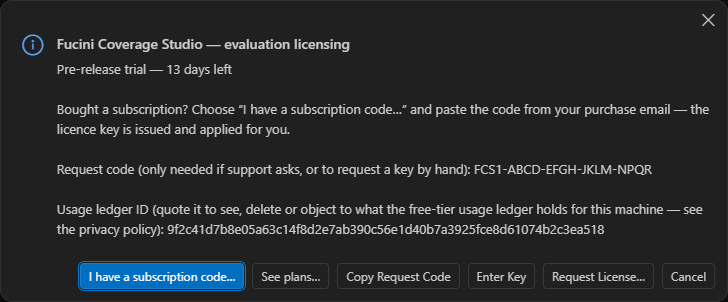 Screenshot pending — add assets/img/licence-dialog.png (see SCREENSHOTS.md).
- Run
Fucini Coverage: Show License / Activation(also reachable from the status bar once the trial/key has expired) and click Request License… (or Request Renewed Key… if you've activated before). - Confirm the request. The key is issued automatically, and your contact details from any prior request are reused rather than asked for again.
- That's it. The activation key is generated and written to
fuciniCoverage.license.keyautomatically. The status bar switches from the trial to an activated license within a moment.
The manual route in one picture: open the licence panel, choose Enter Key, paste the key from your email, and the banner turns to “Activated”.
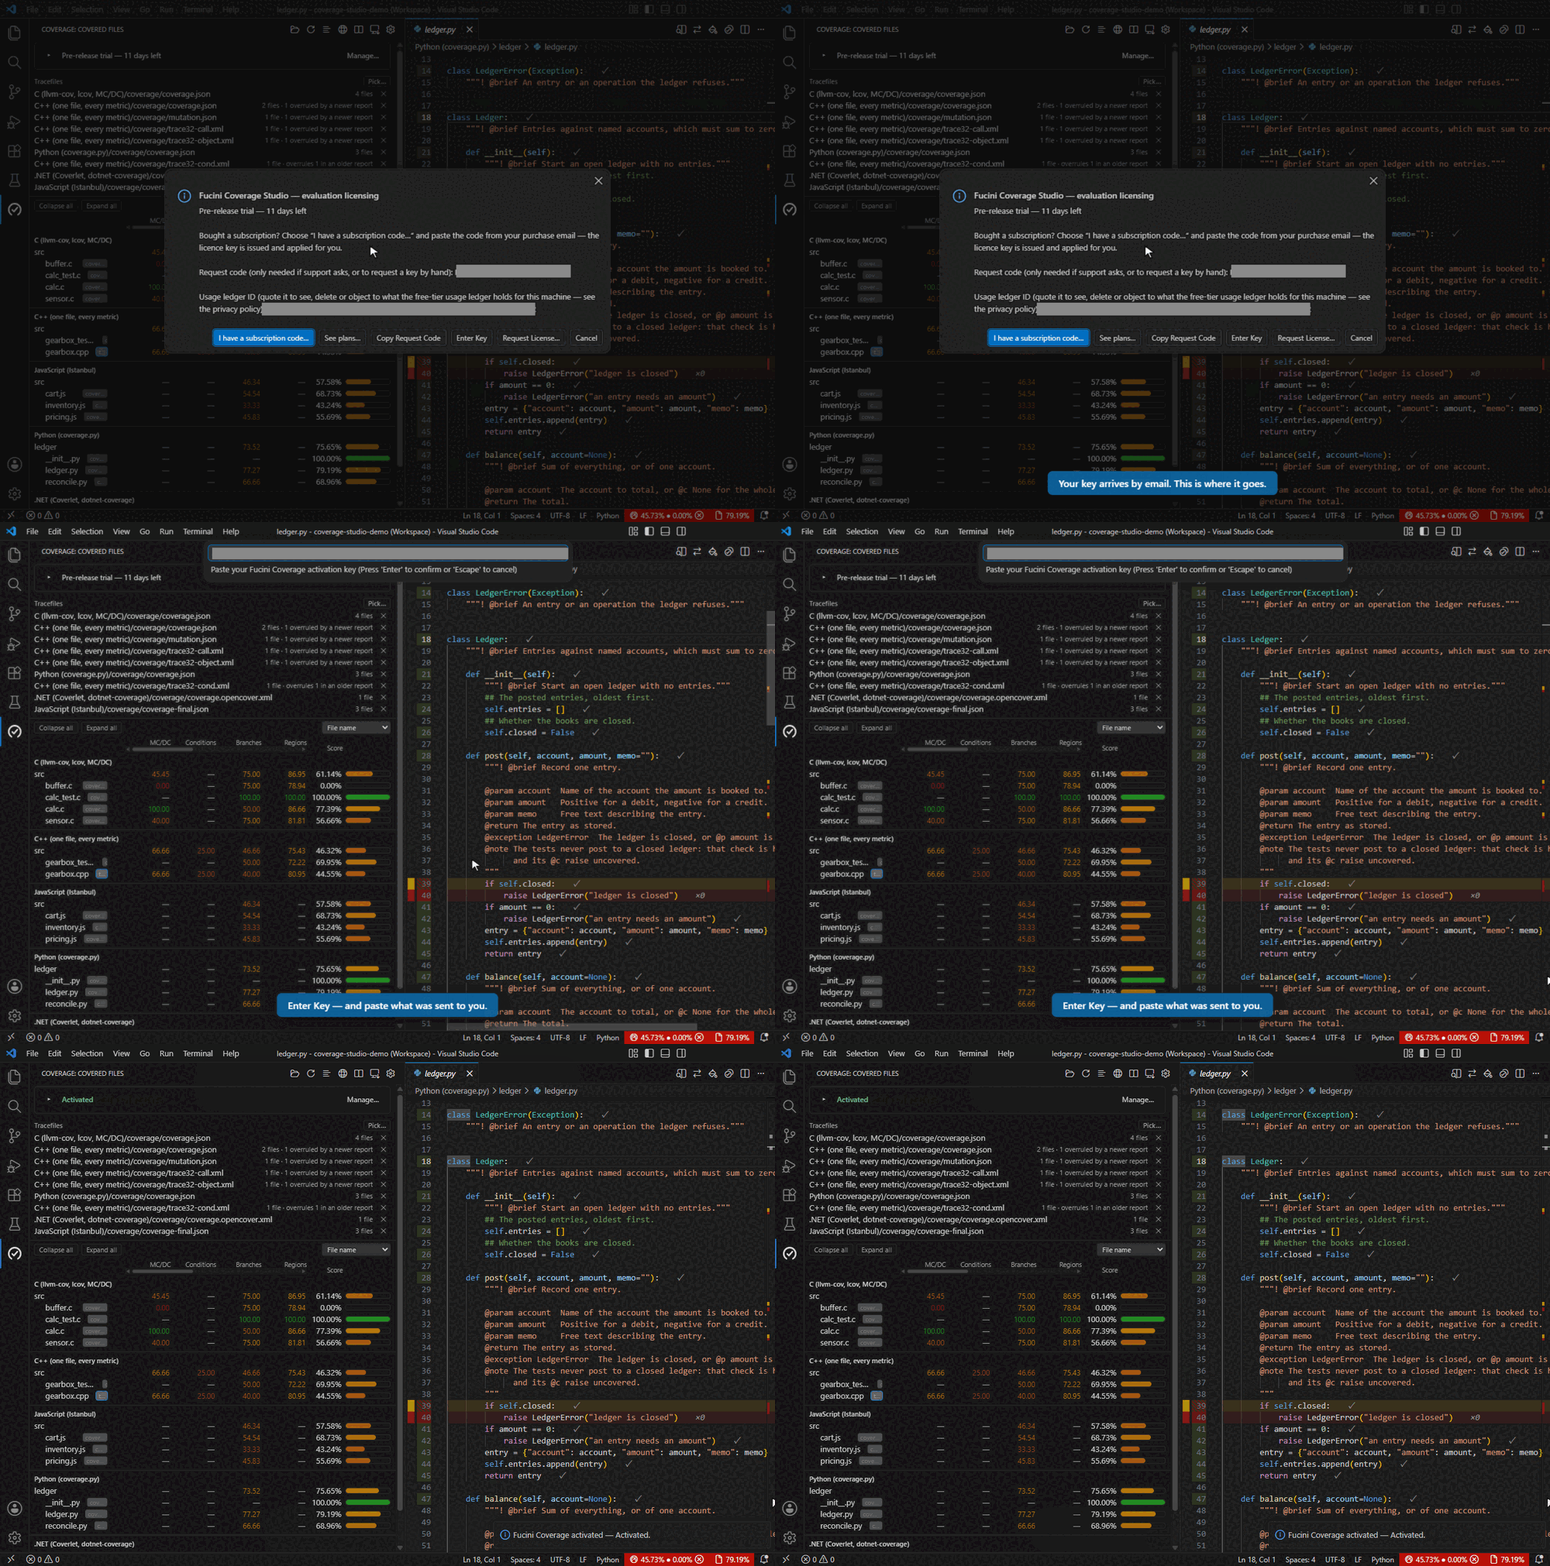 Screenshot pending — add assets/img/activate-key.gif (see SCREENSHOTS.md).
If the automated request ever fails (no connection, server issue): run Fucini Coverage: Copy Activation Request Code, send it via the contact page or info@fucini.consulting, and paste the FCK1.… key you receive back with Fucini Coverage: Enter Activation Key (or directly into settings.json):
{
  "fuciniCoverage.license.key": "FCK1.…paste the whole key…"
}
The setting name is fuciniCoverage.license.key (user/global scope). The key is bound to your machine and OS user, may carry an expiry, and can enable or limit individual features and cap coverage loads per day. If it shows “invalid for this machine”, request a fresh key from this install — a key issued for a different machine will never validate here.
In Visual Studio. There is no free tier in that edition: without a subscription nothing is read. With one, the plan decides there what it decides in VS Code — a feature the plan leaves out is withheld, and its command says so instead of running. The oldest version the licence server still supports holds there as well: a build below it is told once a day, with the date it stops, and goes on working until then. Being offline never stops a build.
The free Community tier: a weekly allowance
Community never stops showing coverage. The gutters, the overview ruler, hovers, CodeLens, the Coverage view, watch mode, diff coverage and history are not counted at all, and loading a tracefile by command is capped only at 25 a day. What is metered is output: five a week each of opening the HTML report, exporting, comparing two runs, checking the thresholds and viewing the annotated source in place.
A week is yours, not the calendar's: it starts with the first use and ends seven days later. When an allowance is used up the message names the action and the day it comes back, and after that one message only the status bar mentions it. Fucini Coverage: What Community Includes lists every allowance with how much is used and when it resets, before you ever reach one.
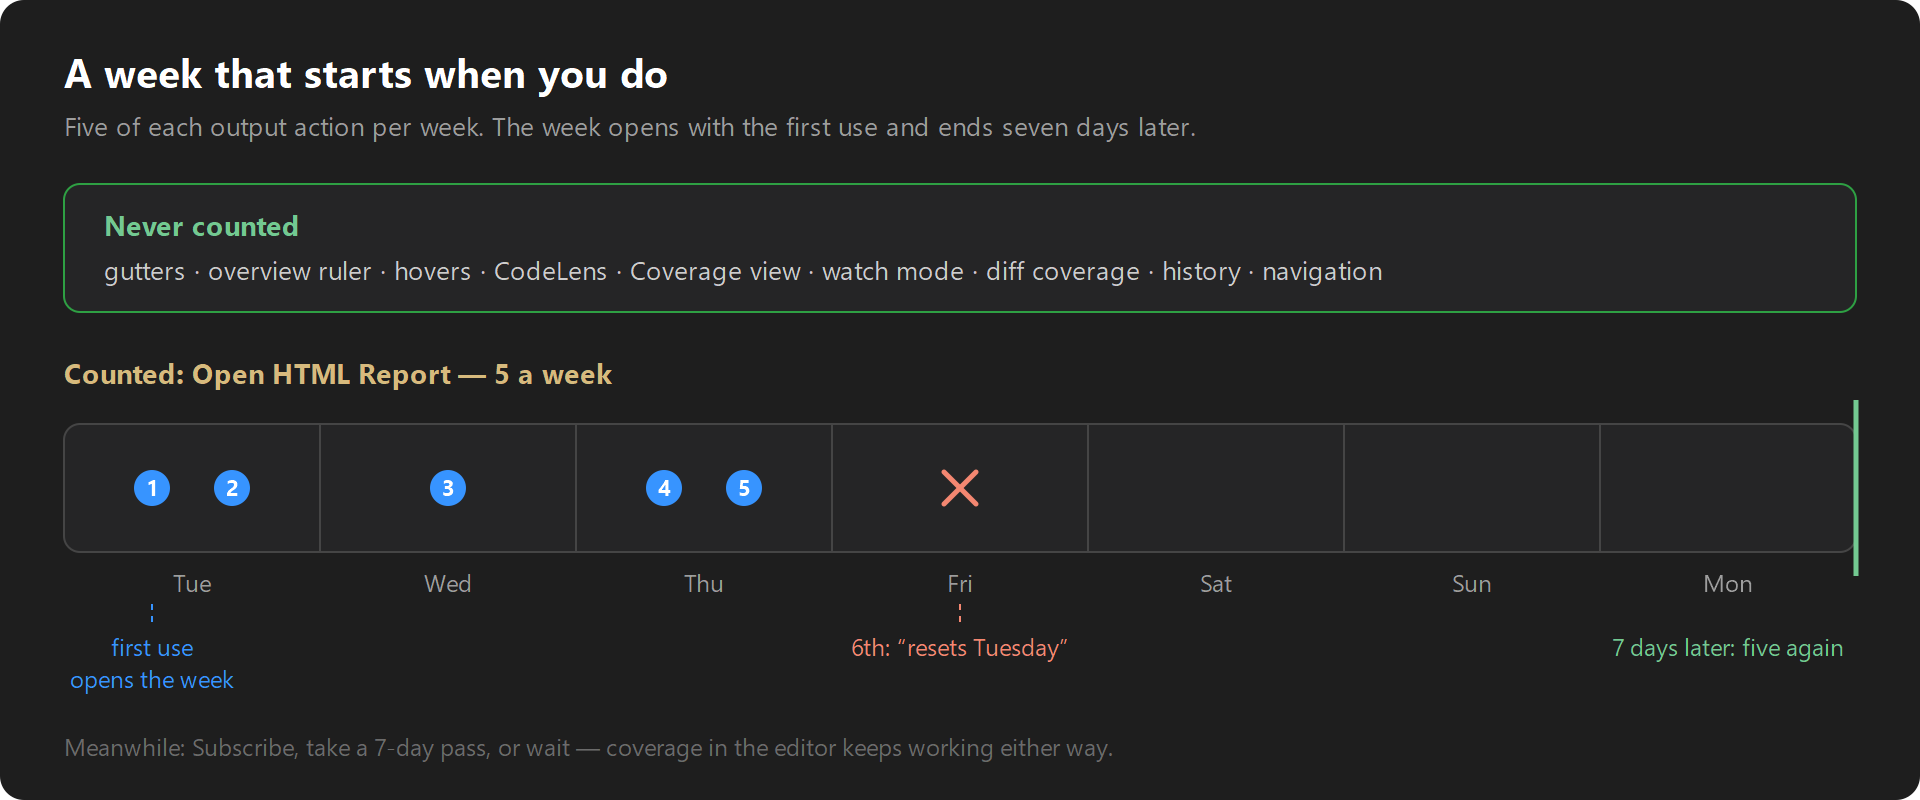 Screenshot pending — add assets/img/weekly-allowance.png (see SCREENSHOTS.md).
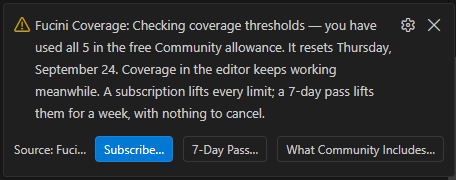 Screenshot pending — add assets/img/community-limit-prompt.png (see SCREENSHOTS.md).
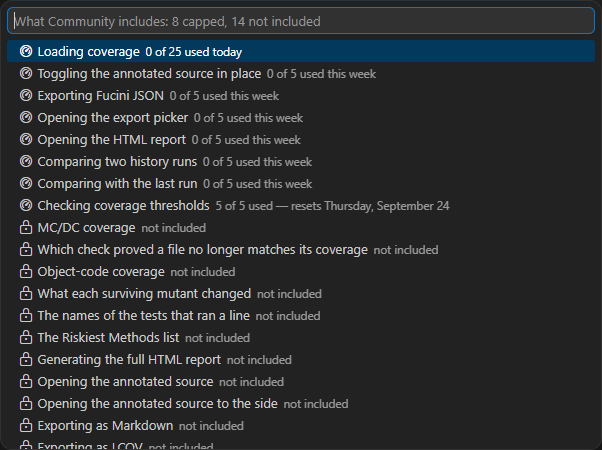 Screenshot pending — add assets/img/community-includes-weekly.png (see SCREENSHOTS.md).
Three details belong to the paid plans while their findings stay free: Community marks every line that has surviving mutants and says how many, but not what each mutant changed; it says how many tests ran a line, but not their names; and it shows a run's Max CRAP, but not the ranked Riskiest Methods list.
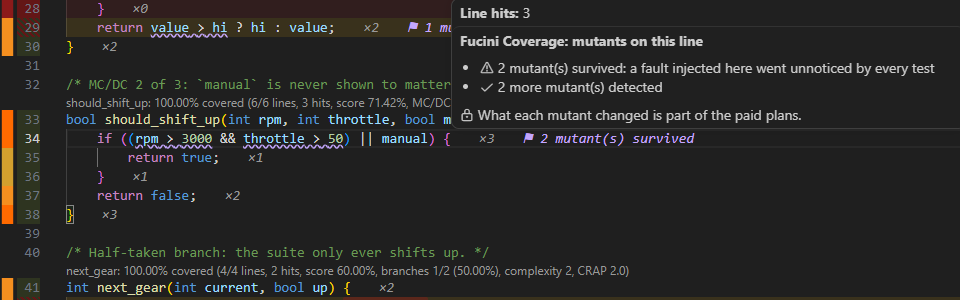 Screenshot pending — add assets/img/mutant-hover-community.png (see SCREENSHOTS.md).
If you were already using Community when the weekly allowance arrived (0.2026.83), your previous caps stay for 30 days; you are told once, with the date. The counters are kept on your machine — in VS Code's own storage and in ~/.fucini-coverage/, so a new VS Code profile continues the same week — and are never sent anywhere.
The 7-day pass
Not ready for a subscription? A 7-day pass is everything in Pro for one week, paid once: nothing renews and there is nothing to cancel. Buy it on the pricing page (the message at a Community limit has a button for it), and the activation code arrives by email.
 Screenshot pending — add assets/img/pricing-week-pass.png (see SCREENSHOTS.md).
- Run
Fucini Coverage: Enter Subscription Code— it exists in the Community edition and in Pro alike. - Choose Pro and paste the
FCB1-…code from the email. - That's it. The key is issued and applied for you, and works offline. The week runs from the payment, so activate when you buy. When it is over the extension returns to Community by itself and keeps showing coverage.
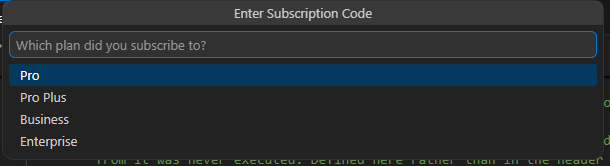 Screenshot pending — add assets/img/pass-step-plan.png (see SCREENSHOTS.md).
 Screenshot pending — add assets/img/pass-step-code.png (see SCREENSHOTS.md).
In Visual Studio. The same code activates Fucini Coverage Studio for Visual Studio, 2022 and 2026: open Tools → Coverage Studio → Licence…, paste the code, choose the plan it is for and press Activate. The Coverage window then says Activated above the tree; opened with its caret, the row shows the date the key is valid until and a button to your account. One machine is one seat: activate VS Code or Visual Studio, and the other editor on the same machine follows by itself — Visual Studio reads VS Code's key and VS Code reads Visual Studio's — so nothing is entered twice and no second seat is taken. Both keep a key alive the same way: Pro Plus, Business and Enterprise check in twice a day, and a Pro key is renewed in the week before it runs out.
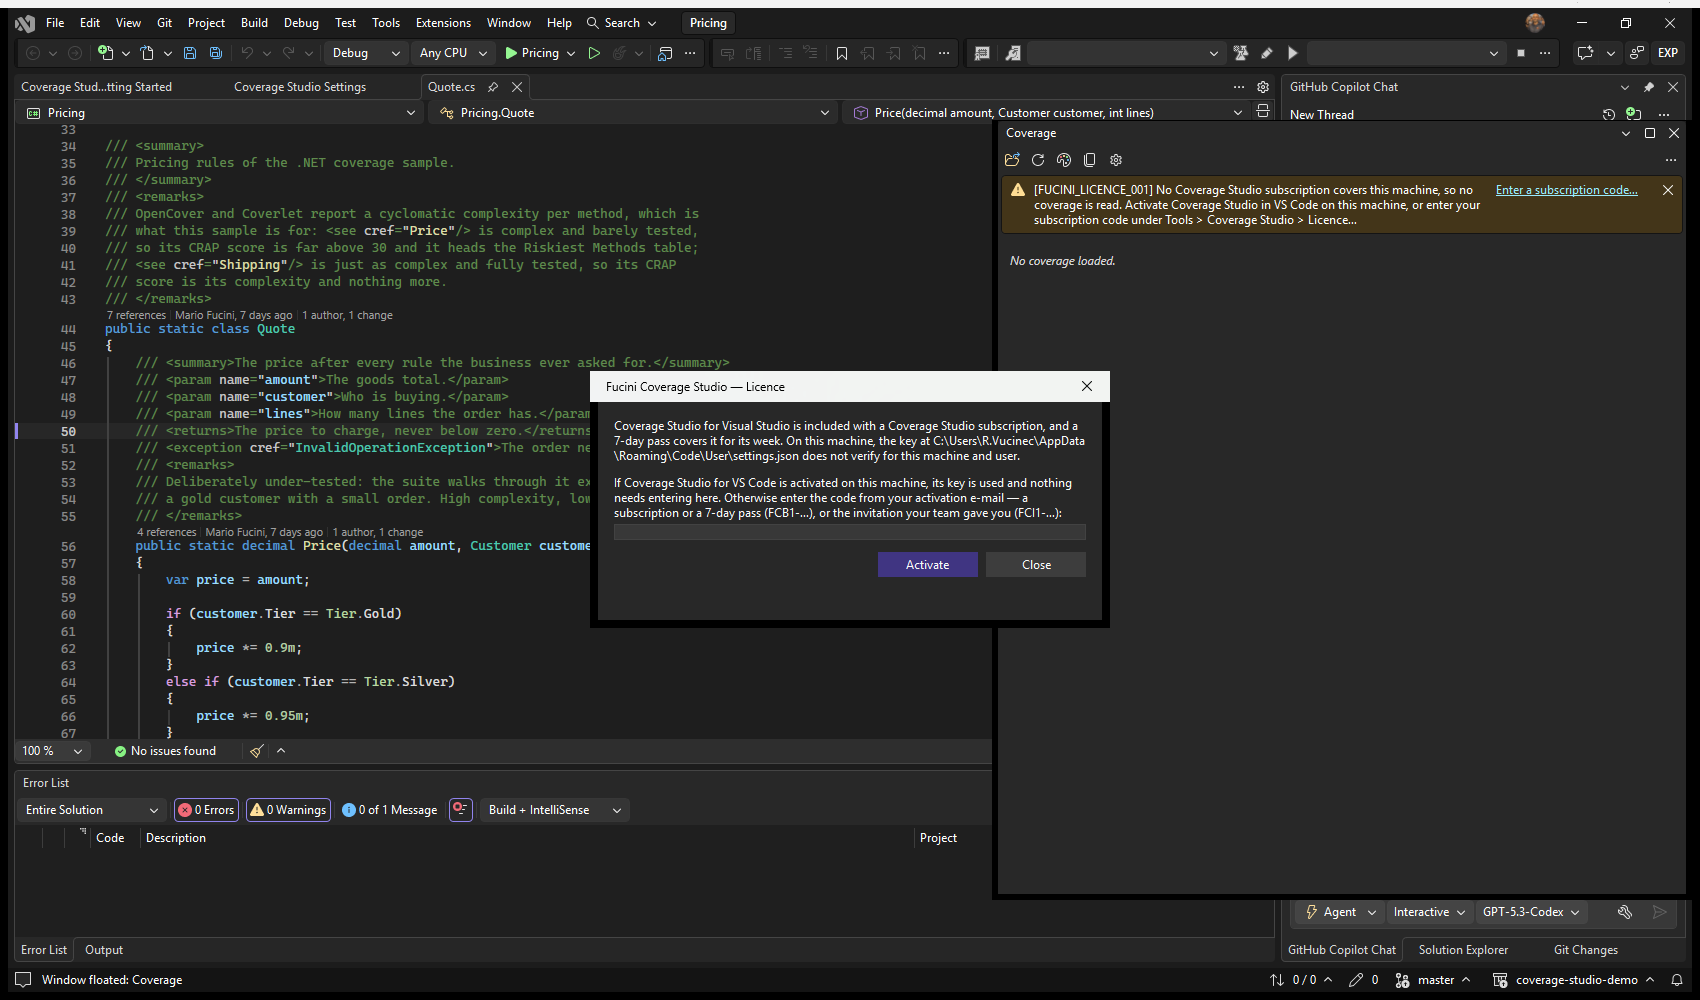
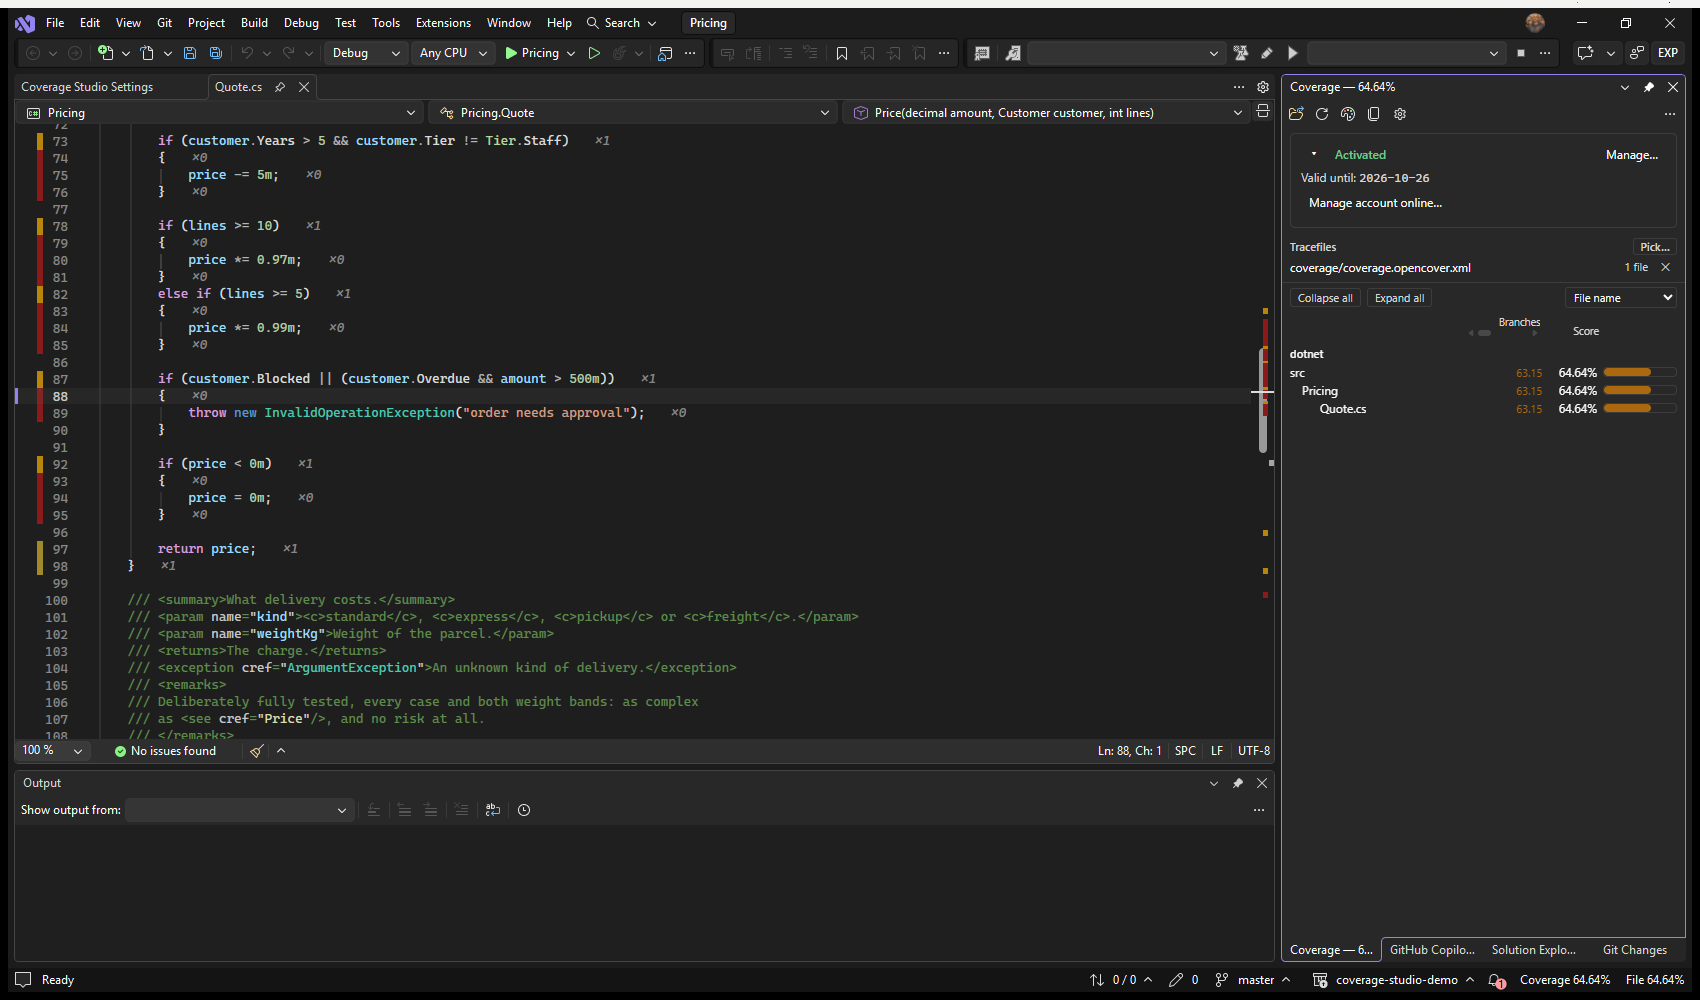
Moving to a new computer, and managing seats
A key is bound to one machine, so a new computer needs a new one — and your subscription only pays for as many machines as it says. Free the old one yourself: sign in at manage your subscription, find the seat you no longer use and choose Free up, then activate the new machine with the same code. Buying Pro does not email you a password — your account exists, it simply has none yet, so the first time you go there use set or reset your password with the address you subscribed with.
On Business and Enterprise, invite each colleague by email from that same page. Everyone gets an activation code that is theirs alone, and once they use it their address appears against their seat — so when somebody leaves you can see which seat was theirs and free it for the next person. An invitation holds a seat from the moment you send it and expires after 14 days if it goes unused; withdraw one to get the seat back straight away.
Testing pre-release builds
New work reaches fucini.software before it reaches the Marketplace, and you can ask to be offered it. Open the Coverage view, expand the licence panel and press Test pre-release builds… — or set fuciniCoverage.update.preRelease. From then on the extension checks a separate pre-release feed here as well as the ordinary one, and offers whichever is newer.
 Screenshot pending — add assets/img/licence-prerelease.png (see SCREENSHOTS.md).
Pre-releases are tested, but they are the builds we are least sure of — you would be volunteering to find what we missed. Joining tells us that this installation is on the channel, so we know how many people are testing and can say what changed; leaving puts you back on the ordinary path at the next stable release. There is not always a pre-release to be had, and joining when there is none costs nothing: the extension finds an empty feed, says nothing about it, and goes on offering stable releases until one is published.
 Screenshot pending — add assets/img/licence-prerelease-joined.png (see SCREENSHOTS.md).
20. Contact & license
Questions, bug reports, or alternate licensing terms — see the contact page or email info@fucini.consulting. Licensed under MIT with an attribution-in-release-notes condition; see also the Notice.
21. On the command line
The reader runs without an editor as well: npm install -g fucini-coverage, free, on Windows, Linux, WSL and macOS. fucini-coverage check coverage/lcov.info --lines 80 is the gate a pipeline fails on; summary, export, report, badge and compare do what the editors' commands of those names do, and mcp serves the six tools of the section above to an agent on a server. It reads fucini-coverage.json, the settings file the Visual Studio edition reads, so the thresholds are set once. fucini-coverage help <command> explains each; the full page is fucini-coverage on npm.
 Screenshot pending — add assets/img/cli-demo.gif (see SCREENSHOTS.md).