Free to start. Fucini Coverage Studio runs free for a 14-day trial with everything unlocked. After that it settles into the free Community tier rather than locking you out — every feature except MC/DC, with generous monthly caps on a few. Upgrade any time for the unrestricted set, or unlock everything for free by sharing detailed usage telemetry. See plans →
Coming next: all of this coverage in Azure DevOps, as a free extension. Azure DevOps shows coverage on a build only as far as its own format goes — lines, and branches as a percentage. Fucini DevOps Studio will show the whole of what Coverage Studio reads: every one of these 25 formats, for every language, with MC/DC, conditions, the composite score and the gates, as a Coverage tab on the pipeline that produced it. Follow the news for the first release.
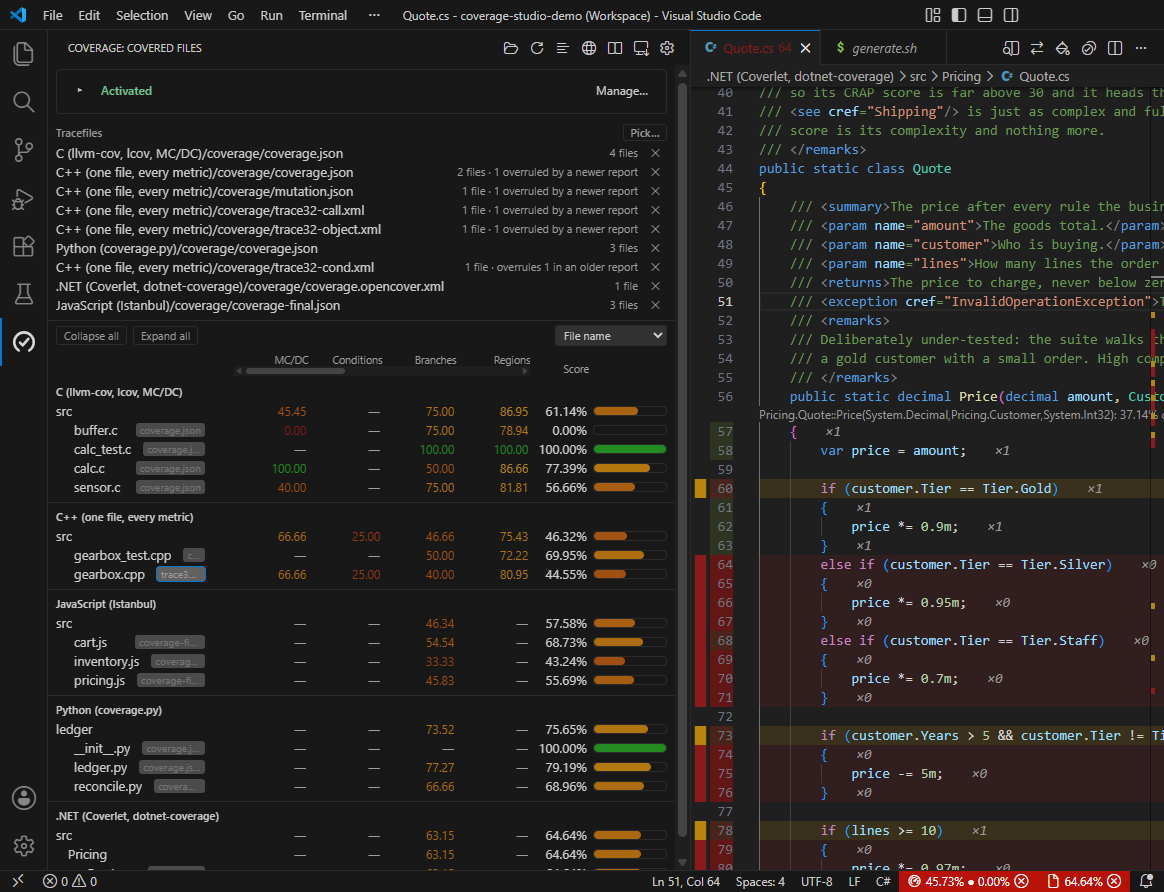 Screenshot pending — add assets/img/hero.png (see SCREENSHOTS.md).
When an AI wrote the tests
A generated test suite looks thorough. Coverage tells you whether it is.
A language model will write you a test suite in seconds, and it will read convincingly. What it cannot tell you is whether those tests reach anything that matters — and neither can line coverage, because a test with no assertions at all still lights up every line it touches.
◆ Decisions, not just lines
MC/DC and branch coverage show whether each decision was actually
exercised, not merely whether the line was reached. Generated tests characteristically walk the happy path and
leave the other side of every if untouched — which reads as 100% line coverage and 50% branch
coverage. That gap is the finding.
◆ Functions nothing ever called
Dead-code detection lists the functions no test reached at all. A generated suite names them in its test titles and never gets to them, which is invisible in a green test run.
◆ Tied to the change in front of you
Diff coverage measures only what changed against a git baseline, so "the tests pass" becomes "the code you just accepted is tested". Works the same whether a person or an assistant wrote it.
None of this proves a test is good — nothing can. It tells you, precisely and per line, what was never run: the part a reviewer cannot hold in their head and an assistant will not volunteer. Works with TypeScript and JavaScript through Vitest, Jest or nyc, and with C, C++, Java and Ruby through the tracefiles those toolchains already emit.
Why it's different
One model, every format, zero custom viewer
◆ Twenty-five formats in
LCOV, llvm-cov JSON, Cobertura, JaCoCo, Istanbul/nyc, SimpleCov, Clover, OpenCover, coverage.py, gcov JSON and plain text, Go, Coveralls, SonarQube, GNATcoverage, Bullseye, Visual Studio, Xcode, VectorCAST, Testwell CTC++, TRACE32, EMMA, UCIS/UCDB, NCover and dotCover — auto-detected and merged deterministically with recorded provenance.
◆ Native UI out
Line, branch and function gutters, the overview ruler, Explorer badges and a Covered Files view.
◆ MC/DC & regions
Modified Condition/Decision Coverage, region and C++ instantiation coverage from llvm-cov, with per-decision hover breakdowns.
◆ Safety-weighted score
A single Weighted Harmonic Mean across every metric, with weights aligned to IEC 61508 / ISO 26262 / DO-178C tiers.
◆ Compliance gating
COMPLIANT / NON-COMPLIANT verdicts with per-metric thresholds and strict, whm, both or either modes.
◆ Diff coverage
Restrict decorations to lines changed versus a git base ref — perfect for reviewing exactly what a PR did or didn't cover.
Up and running in 30 seconds
- Install the extension and open your project.
- Run your tests — Command Palette →
Fucini Coverage: Run Tests with Coverage. It recognises vitest, jest, pytest, go, cargo, dotnet, maven, gradle, phpunit and ctest, runs your tests with coverage on and loads what they write. Already have a tracefile?Fucini Coverage: Pick Coverage Fileloads it and remembers it. - Open a source file — the gutter shows which lines ran, the status bar the file’s percentage, a hover each line’s hit count, and the run is in the Coverage view and in VS Code’s own Test Coverage panel. From then on it reloads by itself whenever the tracefile changes.
Requires VS Code ≥ 1.88, or Visual Studio 2022 or 2026 — Community, Professional or Enterprise — plus a coverage tracefile your project already produces. In Visual Studio 2022 the built-in coverage is Enterprise-only; Coverage Studio for Visual Studio shows it on Community and Professional too, from the file your build already writes.
How it compares
VS Code itself and several free extensions show coverage too. This is what each one’s own documentation says it does, as of September 2026 — where a README does not mention something, the table says so rather than guessing.
| Fucini Coverage Studio | VS Code, built in | Coverage Gutters | Code Coverage (markis) | Gcov Viewer | |
|---|---|---|---|---|---|
| Where the coverage comes from | 25 tracefile formats, plus PIT and Stryker mutation reports | a testing extension that reports coverage | lcov and XML files | lcov files | GCC’s .gcda files, through gcov |
| Uncovered lines in the editor | ✓ | ✓ | ✓ | ✓, and in Problems | ✓ |
| Branch coverage, per arm | ✓ | when the testing extension reports it | not described | not described | not described |
| MC/DC | ✓ (Pro) | — | not described | not described | not described |
| Several tracefiles merged, and which one covered each line | ✓ | — | several files supported | not described | not described |
| Reloads when the tracefile changes | ✓ | shows the last test run | ✓ | not described | not described |
| Diff coverage, thresholds and history | ✓ | coverage shown in the diff editor | not described | not described | not described |
| HTML report | generated, self-hosted | — | previews an existing one | not described | not described |
| Coverage for AI agents: language-model tools and an MCP server | ✓ | not described | not described | not described | not described |
| The tests that ran a line, and the tests your changes affect | ✓ | coverage per test, when the testing extension reports it | not described | not described | not described |
| Mutation testing results in the editor | ✓ (PIT, Stryker) | not described | not described | not described | not described |
| A gate on new code | ✓ | not described | not described | not described | not described |
| The same numbers in Visual Studio and on the command line | ✓ | — | not described | not described | not described |
It is not either/or with VS Code’s own view: every load is published to the native Test Coverage panel as well, filter by test included. Something here out of date? Say so on the contact page.
Supported formats
| Format | Typical file |
|---|---|
| LCOV | lcov.info, *.info |
| llvm-cov JSON | llvm-cov export --format=json |
| Cobertura XML | coverage.xml |
| JaCoCo XML | jacoco.xml |
| Istanbul / nyc | coverage-final.json |
| SimpleCov (Ruby) | .resultset.json, coverage.json |
| Clover XML | clover.xml |
| OpenCover XML | coverage.opencover.xml |
| coverage.py JSON | coverage.json (coverage json) |
| gcov / gcovr JSON | gcov --json-format --stdout, gcovr --json |
| Go coverage profile | coverage.out |
| SonarQube generic | <coverage version="1"> XML |
| GNATcoverage XML (Ada) | gnatcov coverage --annotate=xml |
| BullseyeCoverage XML | covxml output |
| Visual Studio | .coveragexml (dotnet-coverage convert) |
| Coveralls JSON | coveralls.json |
| Xcode xccov JSON | xcrun xccov view --report --json |